
Envision Math 5th Grade Textbook Answer Key Topic 18.3 Graphing Equations
Graphing Equations
How do you graph an equation on a coordinate grid?
Answer:
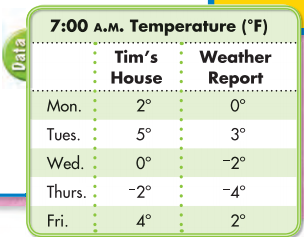
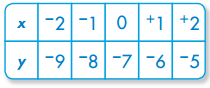
Each day at 7:00 A.M., Tim listed the temperature on his outdoor thermometer and from the radio weather report.
Question.
Write an equation to show the relationship between the temperatures and then graph that relationship.
Answer:
Guided Practice
Do you know HOW?
In 1 and 2, complete the table of values and graph the equation.
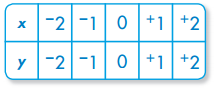
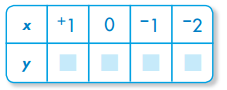
Question 1.
y = x+ +3
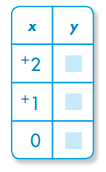
Answer:
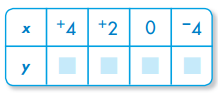
Question 2.
y = x – +4
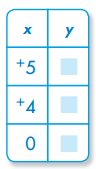
Answer:
Do you UNDERSTAND?
Question 3.
For the problem above, suppose the temperature given in the weather report was 2° F higher than the temperature at Tim’s house. Write an equation, make a table of values, and graph the equation.
Answer:
Question 4.
On your graph for Problem 1, what is the y-coordinate at the point where the line would cross the x-axis?
Answer:
Independent Practice
In 5 through 7, write an equation to describe each table.
Question 5.
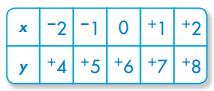
Answer:
Question 6.
Answer:
Question 7.
Answer:
In 8 through 10, complete each table of values and graph each equation.
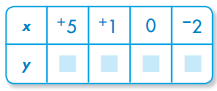
Question 8.
y = x + 1
Answer:
Question 9.
y = x – 3
Answer:
Question 10.
y = 4 + x
Answer:
Write an equation.
Let x = temperature Tim’s house
Let y = temperature given by the weather report
Each day the temperature was reported as 2° lower.
y = x – 2
Use Tim’s list to make a table of values.
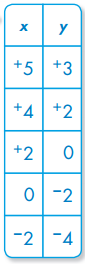
A table of values shows how x and y are related and lists values that satisfy the equation.
Use the table of values to graph the equation.
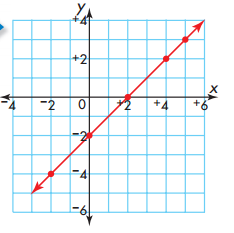
An equation whose graph is a straight line is called a linear equation.
Problem Solving
Question 11.
Reasoning If the points (+1, +7), (+1, +3), (+1, –5), and (+1, –9) were graphed, they would form a vertical line. Do you think the equation for this line would be x = +1 or y = +1? Explain.
Answer:
Question 12.
The Clothes Closet was having a year-end sale. Julie bought 2 pairs of jeans. The jeans cost $28 each. Her state charges 7% sales tax. What was the total cost of the jeans?
Answer:
Question 13.
Which ordered pair will be included on the graph for y = +9 + x?
A. (+6, +3)
B. (–3, +6)
C. (+3, –6)
D. (+6, –3)
Answer:
Question 14.
If you were to walk on Mars, the air near your toes may have a temperature of +18°C, but the air at your head may be 27°C colder. What would be the temperature near your head?
Answer:
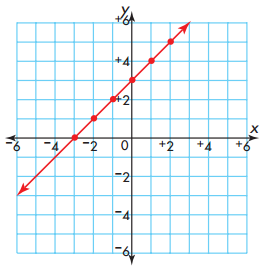
For 15 and 16, use the graph below.
Question 15.
Make a table of values for the graph.
Answer:
Question 16.
Use the table of values to write an equation for the graph.
Answer:
Question 17.
Justin bought a hat for $8.50 and socks for $5.75. He had a coupon for $2 off one item. How much change did he receive if he paid with a $20 bill?
Answer:
Question 18.
Writing to Explain Aaron’s graph included the points (+6, +2), (+3, –1), and (–3, –7). Bob’s graph included the points (+7, +3), (+2, –2), and (–2, –6). Would all six points be included on the same graph? Why or why not?
Answer:
Question 19.
If two pencils cost $0.25, how much would 12 pencils cost?
Answer: