
Envision Math 5th Grade Textbook Answer Key Topic 19.3 Circle Graphs
Circle Graphs
How can you use fractions and percents to label a circle graph?
Answer:
A circle graph shows how all (100%) of a set of data has been divided into parts. Each part is shown by a wedge (sector) of the circle.
Question.
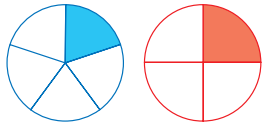
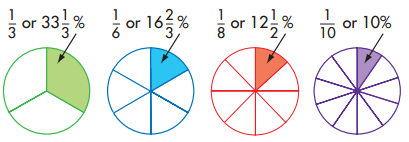
What fraction and percent represents the part of each circle that is shaded?
Another Example
How can you make a circle graph to display data?
Answer:
Sixty students were asked to name their favorite sport. How could you use a circle graph to show the results?
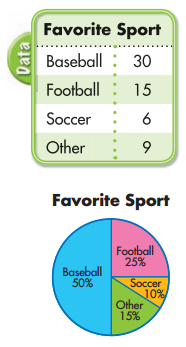
Step 1: Use fractions to find what part of the circle should represent each category. Baseball was chosen by 30 out of 60, and \(\frac{30}{60}\) is 1 or 50%. The wedge for baseball is half the circle.
Football was chosen by 15 out of 60, and \(\frac{15}{60}\) is \(\frac{1}{4}\) or 25%. The wedge for football is \(\frac{1}{4}\) of the circle.
Soccer was chosen by 6 out of 60, and \(\frac{6}{60}\) is \(\frac{1}{10}\) or 10%. The remaining part represents students who chose “other”. It is \(\frac{9}{60}\) or \(\frac{3}{20}\) or 15% of the circle.
Step 2: Draw a circle with sectors for \(\frac{1}{2}\), \(\frac{1}{4}\), and \(\frac{1}{10}\). The remaining sector represents \(\frac{3}{20}\). Label the sectors to show what each part of the circle represents. Often circle graphs are labeled with a percent.
Explain It
Question 1.
If 20 out of 60 students in the survey had chosen baseball, what fraction would represent the part of the circle that should be shaded to show the part of the students who chose baseball? What percent is equivalent to the fraction?
Answer:
Question 2.
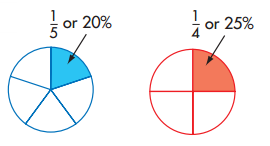
In the circles at the top of the next page, how many of the 12.5% wedges would it take to equal a __ wedge?
Answer:
Question 3.
In the circle at the right, how many wedges should be shaded to show 40%?
Answer:
In the first circle graph, \(\frac{1}{5}\) or 20% is shaded. In the second circle, \(\frac{1}{4}\) or 25% is shaded.
Some other useful fractions for circle graphs are \(\frac{1}{3}\), \(\frac{1}{6}\), \(\frac{1}{8}\), and \(\frac{1}{10}\).
Guided Practice
Do you know HOW?
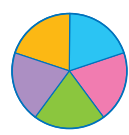
Use the circle below to answer 1 and 2.

Question 1.
If 4 parts of the circle were shaded, what fraction and percent would be represented?
Answer:
Question 2.
If only 1 part were shaded, what fraction and percent would be represented?
Answer:
Do you UNDERSTAND?
Question 3.
In a survey, 20 people out of 80 chose apple. If you made a circle graph, which sector shown in the example above would represent apple?
Answer:
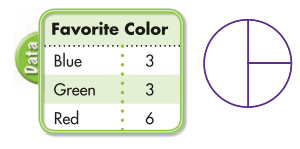
Question 4.
Use the data below. Copy and label the graph. Label each sector with the correct color.
Answer:
Independent Practice
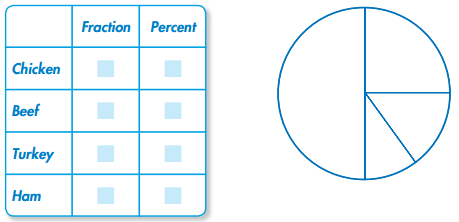
A restaurant offers four main course choices on their dinner menu. One evening the following choices were chosen by 20 customers: chicken, 10; beef, 5; turkey, 3; ham 2.
Question 5.
Copy and complete the table at the right.
Answer:
Question 6.
Copy the circle graph at the right and label each sector with the correct main course.
Answer:
Problem Solving
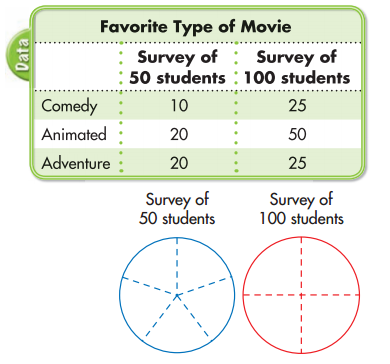
In two different surveys, students were asked to name their favorite type of movie. The results are shown in the table at the right.
Question 7.
In which survey did \(\frac{1}{5}\) of the students pick comedy?
Answer:
Question 8.
In which survey did 50% of the students choose animated movies?
Answer:
Question 9.
Copy each circle graph and label it with the type of movie and the percent. You can remove the dashed lines in your final graph.
Answer:
Question 10.
Number Sense
A circle graph is divided into three sections. One section equals 50%. The other two sections are equal in size. What percent of the circle does each of the other two sections represent?
Answer:
Question 11.
A triangle has a height of 16 mm and a base of 6.4 mm. What is the area of the triangle?
A. 22.4 mm2
B. 44.8 mm2
C. 51.2 mm2
D. 102.4 mm2
Answer:
Question 12.
Think About the Process
Sonya spent $ 18 for a book and $22 for a DVD. She paid $2.40 in tax and received $7.60 in change. Which expression shows how to find the amount of money Sonya gave the clerk?
A. 18 + 22 + 2.40
B. 18 + 22 – 7.60
C. 18 + 22 + 2.40 – 7.60
D. 18 + 22 + 2.40 + 7.60
Answer:
Question 13.
Renee mixed \(\frac{3}{4}\) cup of lime juice, \(\frac{7}{8}\) cup of water, and \(\frac{1}{2}\) cup of ice to make a limeade. Which is a reasonable total for the amount she mixed?
A. Less than 1 cup
B. Between 1\(\frac{1}{2}\) cups and 2\(\frac{1}{2}\) cups
C. More than 2\(\frac{1}{2}\) cups
D. Less than 2 cups
Answer:
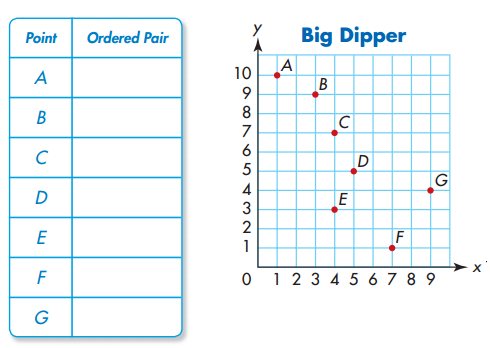
Question 14.
A survey asked 200 people to name their favorite type of fruit. The results were as follows: apple, 100; banana, 50; orange, 25; other, 25. Which graph best represents the data?
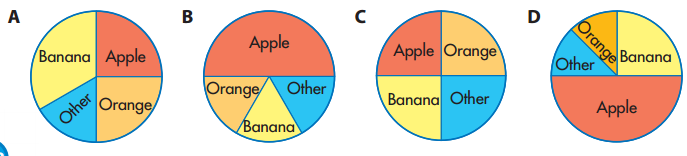
Answer:
Mixed Problem Solving
Objects on Jupiter weigh about two and a half times as much as on Earth.
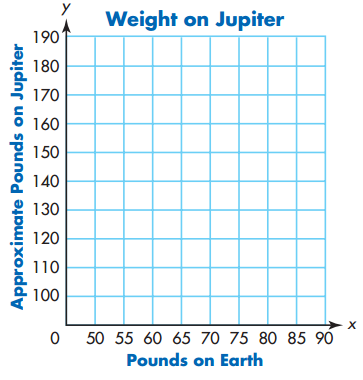
Question 1.
Complete the table below and then graph the values on the coordinate grid.
Answer:
Question 2.
If a dog weighs 75 pounds on Earth, about how much would it weigh on Jupiter?
Answer:
Question 3.
If Tyler weighs 120 pounds on Jupiter, about how much would he weigh on Earth?
Answer:
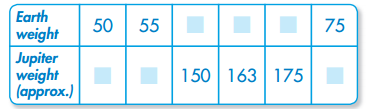
Question 4.
Complete this table using the graph that shows the Big Dipper.
Answer:
Question 5.
If you were to move this drawing of the Big Dipper 3 units to the right on this grid, what would be the ordered pair for point D?
Answer:
Question 6.
Strategy Focus
Examine the ordered pairs for Points Cand E. How do you know that a vertical line can connect those two points? Explain how you decided.
Answer: