
Envision Math 5th Grade Textbook Answer Key Topic 19.6 Median, Mode, and Range
Median, Mode, and Range
How can data be described by one number?
Answer:
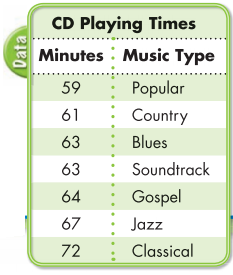
Trey listed, in order, the playing times for the best-selling CD of each music type.
Question.
How can he describe the data with one number?
Answer:
Guided Practice
Do you know HOW?
In 1 through 3, identify the median, mode, and range for each set of data.
Question 1.
5, 7, 5, 4, 6, 3, 5
Answer:
Question 2.
21,21,23, 32, 43
Answer:
Question 3.
13, 14, 14, 16, 17, 19
Answer:
Do you UNDERSTAND?
Question 4.
What operation is used to find the range?
Answer:
Question 5.
In the example at the top, how would the median and mode change if the playing time for the Blues CD changed to 61 minutes?
Answer:
Question 6.
What would the range of playing times be if the 72-minute CD was removed from the list?
Answer:
Independent Practice
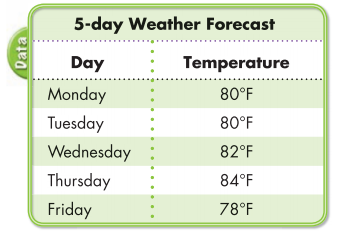
In 7 through 9, use the table at the right.
Question 7.
What are the median, mode, and range for the data?
Answer:
Question 8.
What would happen to the range if the temperature were 82°F on Monday?
Answer:
Question 9.
If the data for Friday were removed from the table, what would the median, mode, and range be?
Answer:
Find the median
List the data from least to greatest.
59, 61, 63, 63, 64, 67, 72
Identify the median, or the middle data value in an odd numbered, ordered set of data.
The median of the number of minutes of playing time is 63.
Find the mode
59, 61, 63, 63, 64, 67, 72
Identify the mode, or the data value that occurs most often in the data set.
The mode of the number of minutes of playing time is 63.
Find the range
59, 61, 63, 63, 64, 67, 72
Identify the range, or the difference between the greatest and least values.
72 – 59 = 13
The range of the number of minutes of playing time is 13.
Question 10.
Ricardo kept a record of the 7 hottest days of the summer. Use the list below to find the median, mode, and range of the temperatures.
98°F 102°F 100°F 99°F
103°F 98°F 101°F
Answer:
Question 11.
Writing to Explain
How can you tell the difference between the net for a triangular prism and the net for a triangular pyramid?
Answer:
Question 12.
Reasoning
For each statistical measure (mean, median, mode, and range) tell whether that number is always, sometimes, or never one of the numbers in the data set.
Answer:
Question 13.
Think About the Process
One side of a rectangular garden is 13 feet and the other side is 3 feet. Which expression shows how to find the perimeter?
A. (2 × 13) + (2 × 3)
B. 13 × 3
C. 2 × 13 × 3
D. 3 + 13
Answer:
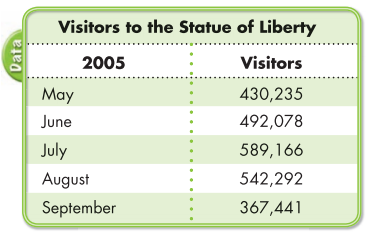
For 14 through 17, use the table.
Question 14.
What was the median number of visitors to the Statue of Liberty from May through September in 2005?
Answer:
Question 15.
What is the range of the data?
Answer:
Question 16.
How many months had over 500,000 visitors?
Answer:
Question 17.
Writing to Explain
Why do you suppose there had been many fewer visitors in September, than in July or August?
Answer: