
Envision Math 5th Grade Textbook Answer Key Topic 18.2 Line Graphs
Line Graphs
How can data be represented?
Answer:
Data is collected information.
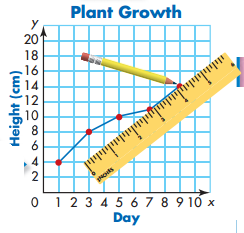
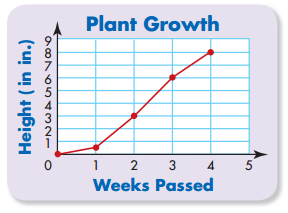
A line graph is used to show how data changes over time. It shows a trend, a general direction in data.
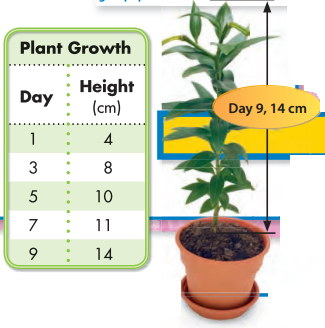
This table shows the growth of a plant over a period of several days. The data can be displayed in a line graph.
Another Example
How can you read data from line graphs?
Answer:
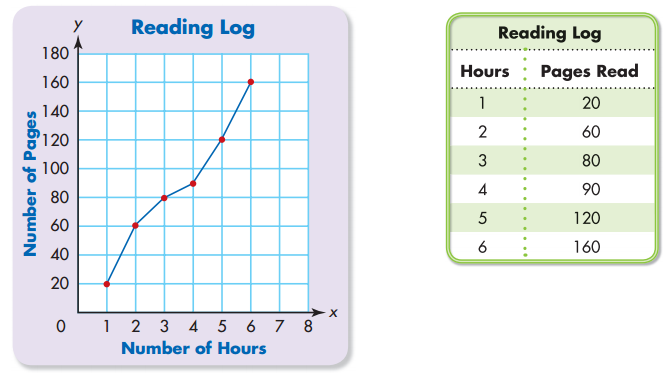
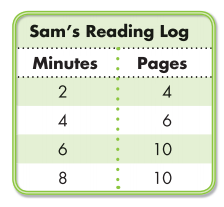
To use data from a graph, locate a point on the graph, and read the values on both axes. To estimate a value not on a graph, interpret the data to determine a trend. The graph below shows Sasha’s reading log.
Explain It
Question 1.
Based on the data, how many pages had Sasha read after 2 hours? After 4 hours?
Answer:
Question 2.
If the trend continues, about how many hours will Sasha take to finish a 190-page book?
Answer:
Question 3.
Using the graph, between what two hours was Sasha reading page 140?
Answer:
Step 1:
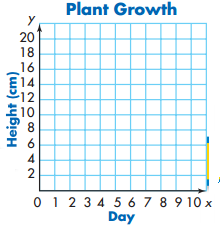
Draw a coordinate grid, use an appropriate scale, and label each axis. Title the graph.
Step 2:
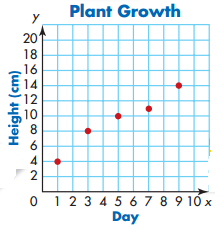
Plot each ordered pair from the table.
Step 4:
Use a ruler to connect the points.
Guided Practice
Do you know HOW?
Question 1.
Use grid paper to make a line graph. Plot the ordered pairs from the table of values. Use an interval of 2 for each axis. Connect each point with a ruler.
Answer:
Do you UNDERSTAND?
Question 2.
In the problem above, between which two days was the plant growth the greatest?
Answer:
Question 3.
If the line connecting the points for several days in a row is horizontal, how much taller did the plant grow during those days?
Answer:
Question 4.
Writing to Explain How can you determine information from a line graph for a point that is not plotted?
Answer:
Independent Practice
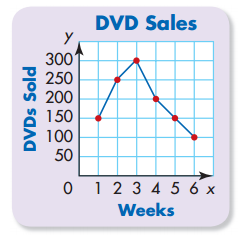
For 5 through 7, use the information from the line graph at the right.
Question 5.
When were the most DVDs sold?
Answer:
Question 6.
How many more DVDs were sold during Week 3 than Week 5?
Answer:
Question 7.
Based on the trend, estimate the number of DVDs sold during Week 7.
Answer:
Problem Solving
Question 8.
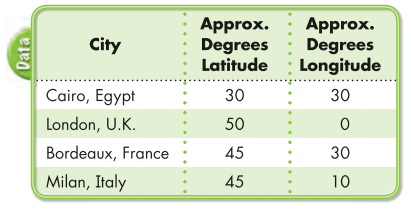
Use the table at the right. On a globe, latitude is the x-coordinate. Longitude is the y-coordinate. What city is located at (30°, 30°)? Where is Milan, Italy, located?
Answer:
For 9 and 10, use the line graph at the right.
Question 9.
Look for a trend. How many inches do you predict the plant will have grown by the end of Week 5?
Answer:
Question 10.
How many more inches did the plant grow from the end of Week 2 to the end of Week 4?
Answer:
Question 11.
Use the table below. How much more did Americans spend on telephone service in 2004 than in 2001?
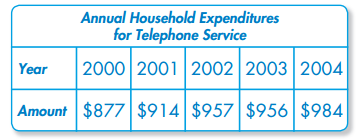
Answer:
Question 12.
Think About the Process If a line graph shows an upward trend in population growth for the past five years, what do you know about the population size during that time?
A. The population decreased.
B. The population inceased and then decreased.
C. The population stayed the same.
D. The population increased.
Answer:
For 13 and 14, use the table at the right. The table shows how far a group of hikers hiked for 4 days.
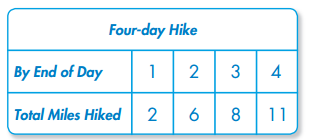
Question 13.
Make a line graph of the data. Use a scale from 0 to 12 and an interval of 2 for the miles hiked. Write a sentence about the trends represented on the graph.
Answer:
Question 14.
During which day did the hikers hike the greatest distance?
Answer:
Mixed Problem Solving
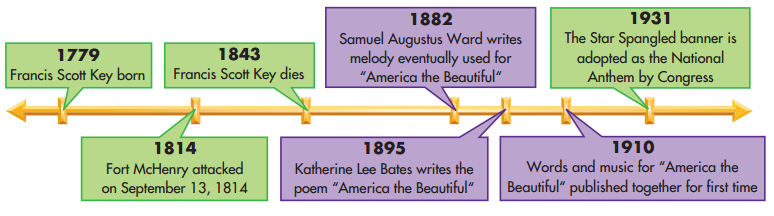
The Star Spangled Banner was written by poet Francis Scott Key. Francis Scott Key wrote this poem during the British attack of Fort McHenry in 1814.
Question 1.
Francis Scott Key was born in 1779 and lived until 1843. During his life, he worked as a lawyer in Washington, D.C., for many famous politicians. How old was Francis Scott Key when he wrote the Star Spangled Banner?
A. 30
B. 32
C. 35
D. 40
Answer:
Question 2.
The Star Spangled Banner was adopted as the National Anthem of the United States by Congress in 1931. How many years after it was written was Francis Scott Key’s poem made the National Anthem?
Answer:
Question 3.
America the Beautiful was written and composed by two different people. Katherine Lee Bates is the author of the poem, “America the Beautiful.” The poem was published in 1895. Samuel Augustus Ward wrote the melody in 1882. The words and music were first published together in 1910. How many years passed between the publication of the poem and the publication of the words and music?
Answer:
Question 4.
How many years after the Star Spangled Banner was written was the poem America the Beautiful written?
Answer:
Question 5.
How many years after Samuel Augustus Ward wrote the melody for “America the Beautiful” did Katherine Lee Bates write the poem?
Answer:
Question 6.
Strategy Focus Solve using the strategy Work Backward.
Elisa has to be at ballet practice at 5:30 P.M. She has 30 minutes of homework to do and then has to eat dinner, which will take 25 minutes. If it takes 20 minutes to get to the ballet studio, at what time should she start her homework?
Answer: