
Envision Math 5th Grade Textbook Answer Key Topic 19.1 Bar Graphs and Picture Graphs
Review What You Know
Vocabulary
Choose the best term from the box,

Question 1.
A(n) ? is either of two perpendicular lines in a graph.
Answer:
Question 2.
A(n) ? is an exact location in space,
Answer:
Question 3.
A pair of numbers used to locate a point on a graph is called a(n) ? .
Answer:
Number Lines
Use the number line to answer 4 through 6
![]()
Question 4.
Which point is halfway between 1 and 2?
Answer:
Question 5.
Which point is closest to 1 than to 2?
Answer:
Question 6.
Which point is closest to 2 than to 1?
Answer:
Writing Fractions
Question 7.
If 3 out of 6 marbles are red, what fraction, in simplest form, names the red marbles?
Answer:
Question 8.
If 1 out of 5 apples is green, what fraction names the part of the apples that are NOT green?
Answer:
Division Patterns
Writing to Explain Write an answer to the question.
Question 9.
How is the number of zeros in the quotient of 45,000 ^ 9 related to the number of zeros in the dividend?
Answer:
Bar Graphs and Picture Graphs
How do you display data collected from a count or measure?
Answer:
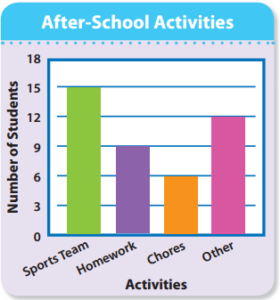
Students were surveyed about what they do after school. The results were displayed in a bar graph.
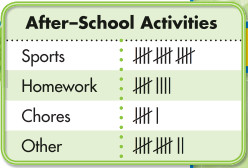
A bar graph uses rectangles (bars) to show and compare data that tells how many or how much.
Answer:
Another Example
How can you make and interpret picture graphs?
Answer:
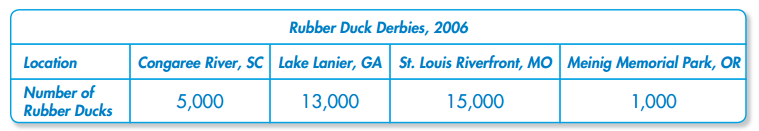
Sonya gathered data about the number of ducks in some of the 2006 rubber duck derbies. Sonya listed the data in a frequency table.
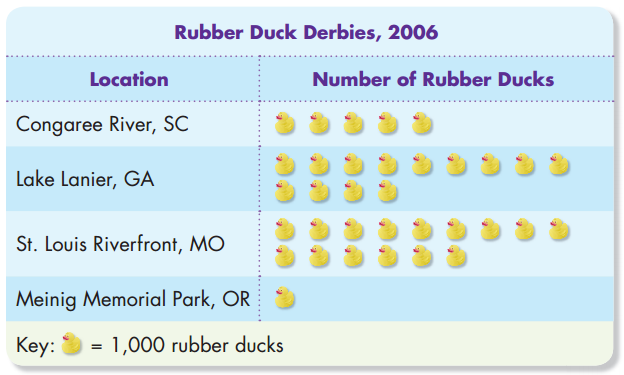
Then she made a picture graph to display the data.
A picture graph uses pictures or symbols to represent data. Each picture represents a certain amount in the data.
Explain It
Question 1.
Which is easier to interpret, a picture graph or a frequency table? Explain.
Answer:
Step 1: List the survey answers along one axis.
Step 2: Choose an interval, the difference between adjoining numbers on an axis. Label both axes. Along the other axis mark the scale, the series of numbers at equal distances. Begin with 0 and include the least and greatest numbers in the survey results.
Step 3: Graph the data by drawing bars of the correct length or height.
Step 4: Title the graph.
Interpret the Graph
Most students play sports. The fewest number of students do chores.
Guided Practice
Do you know HOW?
In 1 and 2, decide if a bar graph or picture graph would better present the data.
Question 1.
The number of cats, dogs, and pet birds in a neighborhood
Answer:
Question 2.
The number of cattle on three ranches
Answer:
Do you UNDERSTAND?
Question 3.
Could the data in the example of the bar graph above be presented in a picture graph? Explain.
Answer:
Question 4.
How are bar graphs and picture graphs similar? How are they different?
Answer:
Independent Practice
In 5 through 8, answer the questions about the picture graph shown to the right.
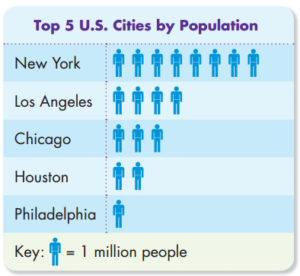
Question 5.
How many people are represented by each picture?
Answer:
Question 6.
What is the difference in populations between the second most populated city and the least populated city?
Answer:
Question 7.
About how many people live in the two most populated cities?
Answer:
Question 8.
Can this data be presented in a bar graph? Explain.
Answer:
Problem Solving
In 9 through 12, use the bar graph.
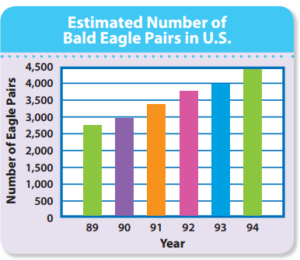
Question 9.
What interval was used for the scale?
Answer:
Question 10.
About how many more eagle pairs were there in 1994 than in 1990?
Answer:
Question 11.
Writing to Explain Based on the graph, do you think the number of pairs of eagles will increase or decrease? Explain.
Answer:
Question 12.
Between which 2 years did the number of pairs of eagles increase the most?
Answer:
In 13 through 15, use the frequency table.
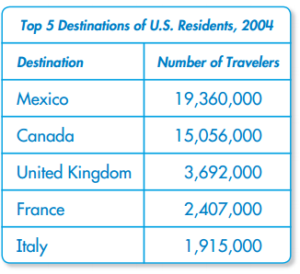
Question 13.
If you were to draw a bar graph for this frequency table, what scale would you use?
Answer:
Question 14.
How many more U.S. residents visited France than Italy in 2004?
Answer:
Question 15.
Writing to Explain
Why do you think more residents went to Mexico and Canada than the other destinations?
Answer:
16. Think About the Process
juli0 bought 3 dozen eggs. He had 13 eggs left after making egg salad for the picnic. Which shows how to find how many eggs Julio used?
A. (13 – 12) × 3
B. (12 – 3) – 13
C. (13 × 12) – 3
D. (3 × 12) – 13
Answer:
Question 17.
Think About the Process
12 soccer teams with 10 students on each team. The school wants to have only 8 soccer teams. Which shows how to find the number of students that would be on each team if there were only 8 teams?
A. Multiply 10 by 8.
B. Divide 120 by 8.
C. Divide 8 by 120.
D. Multiply 12 by 8.
Answer:
Question 18.
Point A represents which mixed number on this number
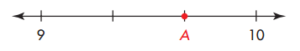
Answer:
Stop and Practice
Find each difference.
Question 1.
-5 ____ +6
Answer:
Question 2.
+7 _____ +3
Answer:
Question 3.
-3 _____ +4
Answer:
Question 4.
+8 ___ +9
Answer:
Question 5.
-10 ____ +2
Answer:
Question 6.
-1 ____ +1
Answer:
Find each product. Simplify if possible.
Question 7.
\(\frac{1}{2}\) × \(\frac{6}{10}\)
Answer:
Question 8
\(\frac{2}{5}\) × \(\frac{1}{5}\)
Answer:
Question 9.
\(\frac{1}{6}\) × \(\frac{3}{4}\)
Answer:
Question 10.
8 × \(\frac{5}{8}\)
Answer:
Question 11.
\(\frac{1}{4}\) × \(\frac{1}{5}\)
Answer:
Question 12.
\(\frac{3}{8}\) × \(\frac{1}{4}\)
Answer:
Question 13.
\(\frac{9}{10}\) × \(\frac{1}{10}\)
Answer:
Question 14.
\(\frac{3}{4}\) × \(\frac{1}{3}\)
Answer:
Question 15.
\(\frac{5}{6}\) × \(\frac{1}{10}\)
Answer:
Find each quotient. Simplify if possible.
Question 16.
3\(\frac{2}{3}\) ÷ 1\(\frac{5}{6}\)
Answer:
Question 17.
1\(\frac{1}{2}\) ÷ 1\(\frac{1}{3}\)
Answer:
Question 18.
6 ÷ \(\frac{7}{8}\)
Answer:
Question 19.
1\(\frac{5}{12}\) ÷ 1\(\frac{5}{12}\)
Answer:
Error Search Find each answer that is not correct. Write it correctly and explain the error.
Question 20.
Answer:
Question 21.

Answer:
Question 22.

Answer:
Question 23.

Answer:
Question 24.

Answer:
Number Sense
Estimating and Reasoning Write whether each statement is true or false. Explain your reasoning.
Question 25.
If a < 0 and b > 0, then a – b is negative.
Answer:
Question 26.
The product of 25 and 2,002 is 50 less than 50,000.
Answer:
Question 27.
The expression (64 ÷ 8) + 2 × (25 ÷ 5) is 50.
Answer:
Question 28.
The sum of 22,256 and 43,008 is less than 65,000.
Answer:
Question 29.
The product of 6\(\frac{3}{5}\) and 7\(\frac{1}{9}\) is greater than 42.
Answer:
Question 30.
The quotient of 13.8 ÷ 2.1 is greater than 4 and less than 7.
Answer: