
Envision Math 5th Grade Textbook Answer Key Topic 19.4 Make a Graph
Make a Graph
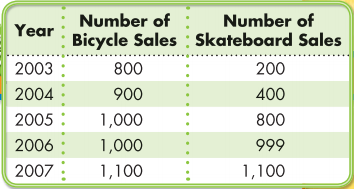
Data for a company’s sales of mountain bicycles and skateboards are shown in the table. Write two statements that compare the sales of bicycles and skateboards.
Question.
Make a line graph for each set of data to help you analyze the data.
Answer:
Guided Practice
Do you know HOW?
Question 1.
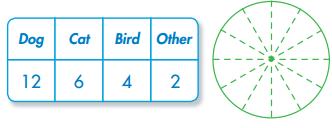
In a survey, students were asked to name their favorite pet. Copy the circle below to make a circle graph to show the data.
Answer:
Question 2.
Make a bar graph to show the data in Exercise 1.
Answer:
Do you UNDERSTAND?
Question 3.
In the example above, if the trend continues, what can you say about the sales of both bicycles and skateboards in 2008?
Answer:
Question 4.
Write a Problem
Write a real-world problem that can be solved by making a graph.
Answer:
Independent Practice
Question 5.
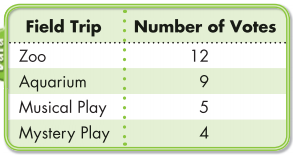
Mr. Lauer surveyed his students to find out what kind of field trip they preferred. Make a bar graph to show the data. Which field trip is most popular?
Answer:
Question 6.
Would a line graph be an appropriate graph in Exercise 5? Why or why not?
Answer:
Plan and Solve
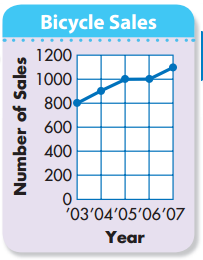
I can make a line graph for bicycle sales
Plan and Solve
I can make a line graph for skateboard sales.
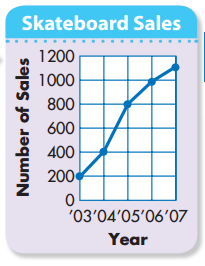
The sales for bicycles and skateboards have been increasing over the years. The difference between the number of bicycle sales and the number of skateboard sales is becoming smaller.
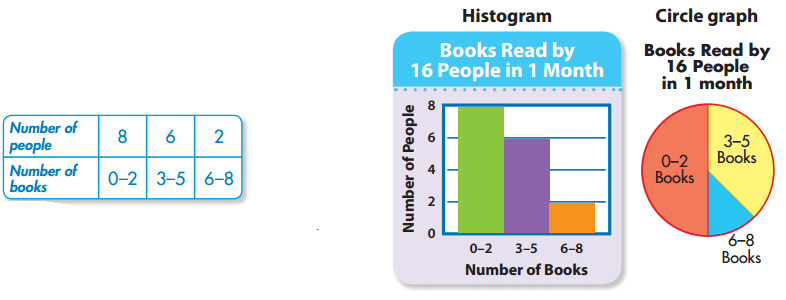
A survey of 16 people recorded the number of books people read in a month. Joe made a histogram and Jean made a circle graph to show the results.
Question 7.
Which graph makes it easy to see that \(\frac{1}{2}\) of the people read 2 or less books in the month? Which graph makes it easy to tell the number of people in each category?
Answer:
Question 8.
Writing to Explain Can you tell from the histogram how many people read 4 books?
Answer:
Question 9.
The data about bicycle sales and skateboard sales at the top of the page could also be shown by a double-bar graph. Part of thengraph is shown at the right. Copy and complete the graph.
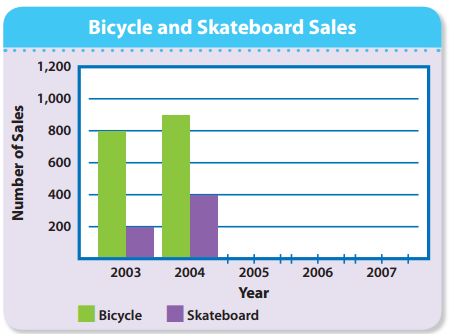
Answer:
Question 10.
A cafe sells turkey, roast beef, ham, or cheese sandwiches; milk, water, or juice; and yogurt or fruit. How many different meals are possible for a person who wants a sandwich, drink, and dessert?
Answer: