
Envision Math 5th Grade Textbook Answer Key Topic 19 Reteaching
Reteaching
Set A, pages 420-422
Students were asked to name their favorite seasons. Make a bar graph to show the results.
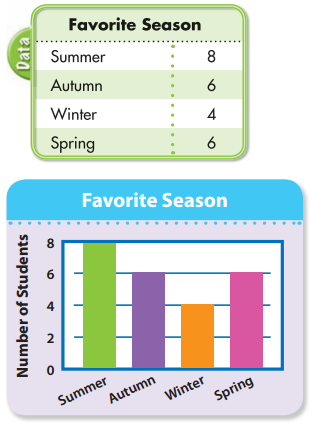
Remember that a bar graph or a picture graph can be used to compare data that shows how many or how much. In a picture graph, each symbol represents a certain amount in the data.
Question 1.
Students were asked to name their favorite flower. Make a bar graph to show the results.
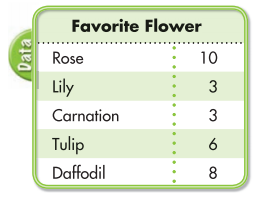
Answer:
Set B, pages 424-425
David made a histogram to show how many books his class had purchased in the last year.
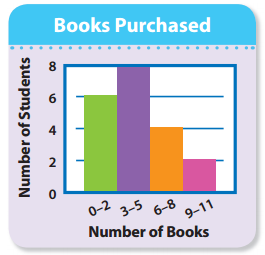
Using the histogram, find the number of students who purchased 3-5 books. The bar with the 3-5 interval has a height of 8. The number of students is 8.
Remember that histograms are a type of bar graph that has no space between the bars and the bars show equal intervals.
Use the histogram at the left to answer the following questions.
Question 1.
How many students were surveyed?
Answer:
Question 2.
How many students had bought more than 5 books?
Answer:
Question 3.
What fraction of the students bought 9, 10, or 11 books?
Answer:
Set C, pages 426–428
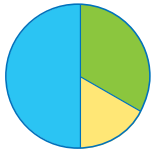
A group of 100 students were asked to name their favorite type of television program. Make a circle graph to show the results.
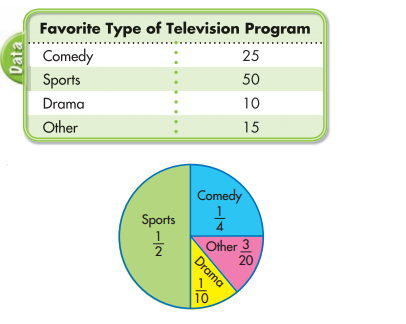
Comedy = 25 out of 100 = \(\frac{1}{4}\)
Sports = 50 out of 100 = \(\frac{1}{2}\)
Drama = 10 out of 100 = \(\frac{1}{10}\)
Other = \(\frac{15}{100}\) = \(\frac{3}{20}\)
Draw a circle with sectors for \(\frac{1}{2}\), \(\frac{1}{4}\), and \(\frac{1}{100}\) and label those sectors with the program type. The remaining sector shows \(\frac{3}{20}\) or Other.
Remember a circle graph shows the whole amount (100%) and each sector represents a part of the whole amount.
Jill spent a total of 30 hours exercising last month: Jogging: 15 hours; Cycling: 10 hours; Swimming: 5 hours.
Question 1.
Copy the circle graph and label each sector with the activity and fraction.
Answer:
Question 2.
What fraction represents the part of the day Jill spent cycling?
Answer:
Set D, pages 430-431
Students were asked to name their favorite animal. Make a bar graph to show the results.
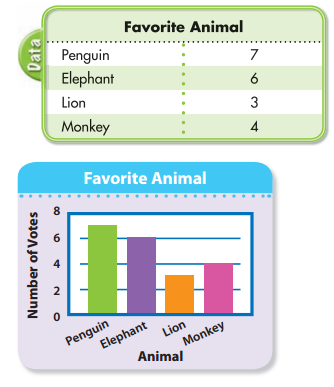
Remember that making a graph makes it easy to visualize data and answer questions about the data.
Question 1.
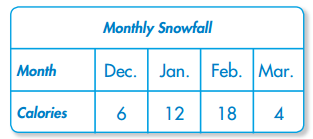
Make a line graph of the data.
Answer:
Question 2.
Which month has a snowfall
Answer:
Question 3.
times as great as December?
Answer:
Set E, pages 432-433
Find the mean of this data set:
2, 3, 8, 3, 5, 6, 1
The mean is an average. To find the mean, add the data and divide by the number of data.
(2 + 3 + 8 + 3 + 5 + 6 + 1) ÷ 7 = 28 ÷ 7 = 4
The mean is 4.
Remember that the mean is an average. You must add the data and divide by the number of addends.
Question 1.
5, 4, 1,3, 1, 10
Answer:
Question 2.
6, 9, 5, 2, 8
Answer:
Question 3.
4, 2, 2, 5, 3, 3, 2
Answer:
Set F, pages 434-435
Find the median, mode, and range for this set of data: 10, 15, 20, 12, 10
To find the median, list the data in order from least to greatest and find the middle value.
10, 10, 12, 15, 20 The median is 12.
To find the mode, list the data in order from least to greatest and find the value that occurs most often.
10, 10, 12, 15, 20 The mode is 10.
To find the range, subtract the least value from the greatest value.
20 – 10 = 10 The range is 10.
Remember that if there is an even number of data, you must add the two middle numbers when the data are ordered from least to greatest and divide by 2 to find the median.
Question 1.
Find the median of this data set:
27.5 27 30 29.5
Answer:
Question 2.
Find the mode of this data set:
12, 6, 9, 5, 8, 12, 8, 1,4, 12, 6
Answer:
Question 3.
Find the range of this data set:
87, 84, 90, 75, 100, 88
Answer:
Set G, pages 436-437
Judy can pick either a hamburger or a chicken sandwich and then either a coleslaw, potato salad, or a fruit salad. How many different lunch combinations can she have?
Draw a tree diagram.
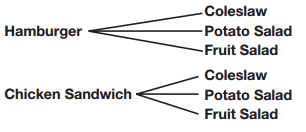
There are 6 possible combinations, so Judy has a choice of 6 different lunches.
Remember that when you make a tree diagram, start with 1 item and list all the possible combinations with it. Continue with all the items.
Question 1.
Make a tree diagram to show the sample space for tossing a number cube and then tossing a quarter.
Answer:
Question 2.
Make a tree diagram to show the results of choosing among tuna, cheese, and turkey sandwiches, and milk and juice drinks.
Answer:
Set H, pages 438-440
You spin the spinner once. Find P (landing in a green section).
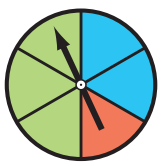
Probability = \(\frac{\text { number of favorable outcomes }}{\text { number of possible outcomes }}\)
So, P (green) = \(\frac{3}{6}\) = \(\frac{1}{2}\)
Remember that when you express a probability as a fraction, always write the fraction in simplest form.
Use the letters in MATHEMATICS. Each letter is written on a separate piece of paper and the pieces are put in a bag.
Find the probability of choosing each letter or letters out of the bag.
Question 1.
P (a consonant)
Answer:
Question 2.
P (the letter A)
Answer:
Question 3.
P (not the letter A)
Answer:
Set I, pages 442-443
To solve a simpler problem, follow these steps:
Step 1:
Break apart or change the problem into one that is simpler to solve.
Step 2:
Draw a picture or use objects to look for a pattern to solve the simpler problem.
Step 3:
Use the answers to the simpler problem to solve the original problem.
Four people shake hands with each other once. How many handshakes are there in all?
Use A, B, C, D to represent the people.
AB, AC, AD BC, BD, CD
There are 6 handshakes.
Remember that you can draw a picture or use objects to look for a pattern in finding the relationship between the simpler problem and the original problem.
Question 1.
How many different teams of 2 people can be chosen from 4 people?
Answer:
Question 2.
How many different teams of 3 people can be chosen from 5 people?
Answer:
Question 3.
What is the sum of the angles of an octagon?
Answer: