Envision Math 5th Grade Textbook Answer Key Topic 2 Test Prep
Test prep
Question 1.
The Chen family’s home has 1,515 square feet downstairs and 625 square feet upstairs. Which of the following is the best estimate of the total square footage in the home? (2-3)
A. 2,100
B. 2,200
C. 2,300
D. 2,500
Answer:
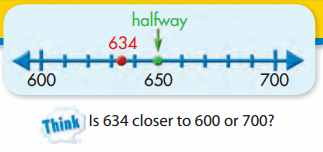
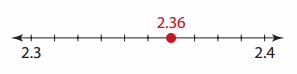
Question 2.
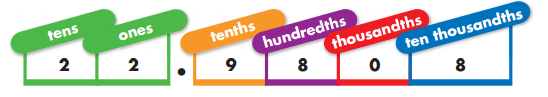
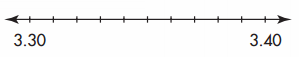
What is 2.934 rounded to the nearest hundredth? (2-2)
A. 2.90
B. 2.93
C. 2.94
D. 3.00
Answer:
Question 3.
Eduardo is training for a marathon. He ran his first mile in 12.567 minutes and his second mile in 12.977 minutes. What is his combined time for the first two miles? (2-5)
A. 24.434 minutes
B. 24.544 minutes
C. 25.444 minutes
D. 25.544 minutes
Answer:
Question 4.
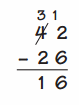
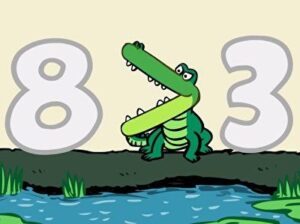
To add 18 + 25 using mental math, Braxton did the following. What is the missing number that makes the statement true?
![]()
A. 43
B. 25
C. 20
D. 2
Answer:
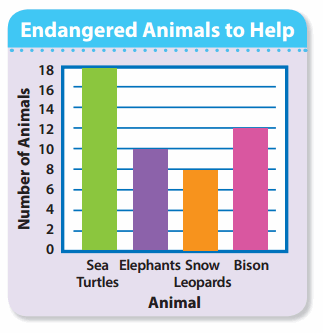
Question 5.
Which two trails combined are less than 4 miles? Use estimation to decide. (2-3)
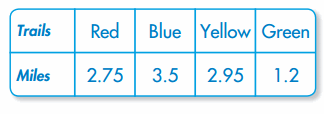
A. Red and Yellow
B. Blue and Green
C. Red and Green
D. Blue and Yellow
Answer:
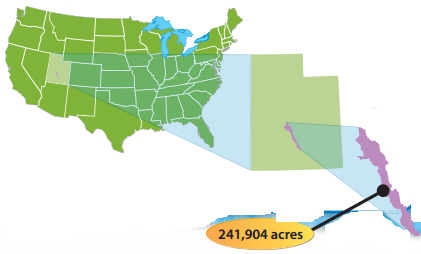
Question 6.
The Thomas Jefferson Memorial is on 18.36 acres of land and the Franklin Delano Roosevelt Memorial is on 7.5 acres of land. How many more acres of land is the Jefferson Memorial on than the Roosevelt memorial? (2-6)
A. 9.86
B. 10.86
C. 11.31
D. 17.61
Answer:
Question 7.
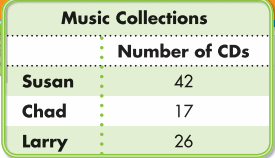
The table shows the areas of two islands. How many more square miles is the area of Greenland than the area of New Guinea? (2-4)
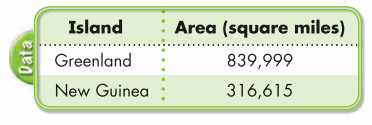
A. 1,156,614
B. 1,145,504
C. 587,716
D. 523,384
Answer:
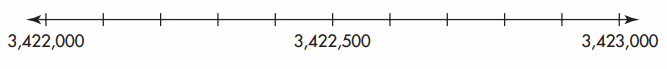
Question 8.
In 2005, there were 2,100,990 farms in the United States. Which of the following is 2,100,990 rounded to the nearest thousand? (2-2)
A. 2,101,100
B. 2,101,000
C. 2,100,900
D. 2,100,000
Answer:
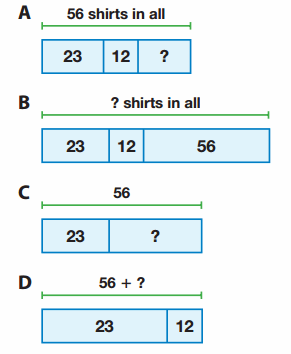
Question 9.
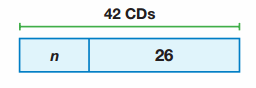
Which picture represents the problem? Parson’s Sporting Goods ordered 56 T-shirts in sizes small, medium and large. If 23 T-shirts are medium and 12 T-shirts are large, how many are small? (2-7)
Answer:
Question 10.
A lecture hall has 479 desk chairs and 216 folding chairs. How many seats are there in all? Use mental math to solve. (2-1)
A. 615
B. 685
C. 695
D. 785
Answer:
Question 11.
Parker had a batting average of 0.287 and Keenan had an average of 0.301. How much higher was Keenan’s batting average than Parker’s? (2-6)
A. 0.256
B. 0.14
C. 0.023
D. 0.014
Answer:
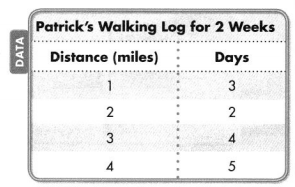
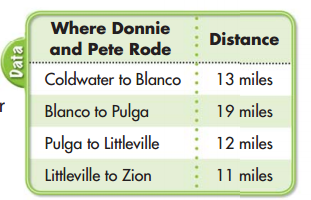
Question 12.
April logged the miles she rode on her bicycle in the table shown. Which is the best estimate of the total miles April rode during the first two weeks? (2-3)
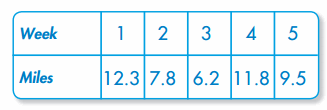
A. 19
B. 20
C. 26
D. 38
Answer:
Question 13.
What is 87.25 + 7.69? (2-5)
A. 79.56
B. 94.2569
C. 94.94
D. 95.94
Answer:
Question 14.
In the 2004 Presidential Election, 62,040,610 people voted for George W. Bush and 59,028,439 people voted for John F. Kerry. What was the total number of votes for the two men? (2-4)
A. 121,069,049
B. 121,068,049
C. 111,069,049
D. 121,169,049
Answer: