Envision Math 1st Grade Textbook Answer Key Topic 2.2 Ordering Three Numbers
Ordering Three Numbers
Home Connection Your child made cube towers and compared three numbers to put them in order from least to greatest.
Home Activity Have your child make a set of number cards from 1 through 12 on slips of paper. Mix up the cards. Have your child select three cards without looking and put them in order from least to greatest and greatest to least
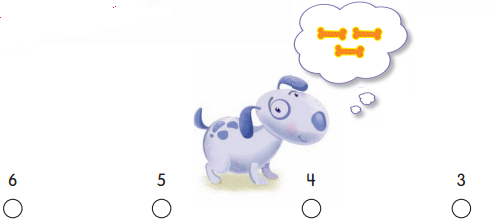
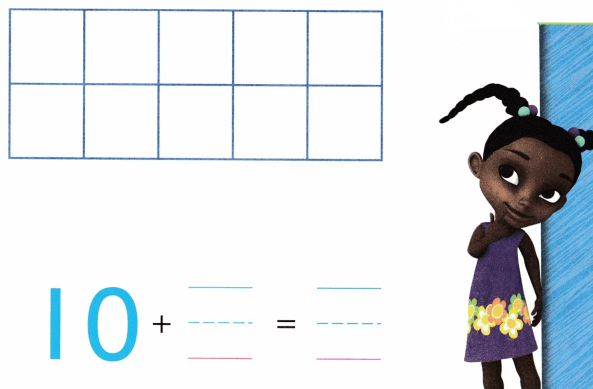
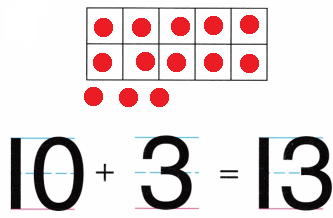
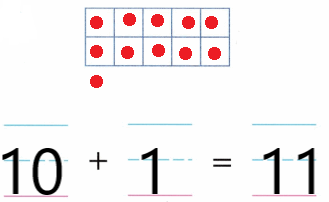
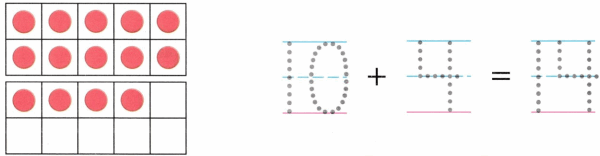
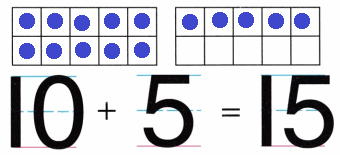
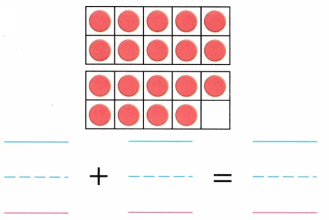
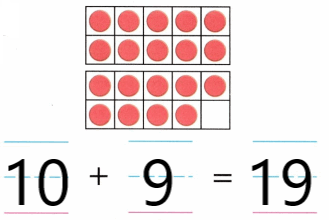
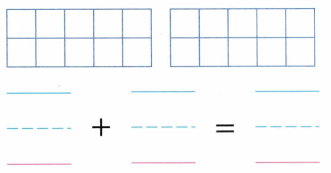
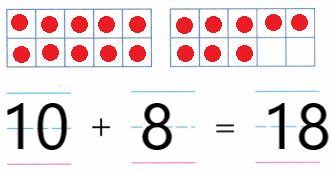
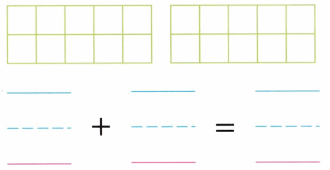
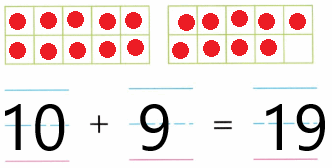
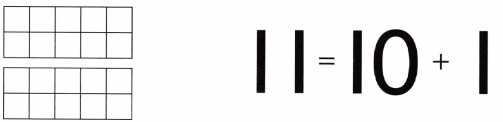
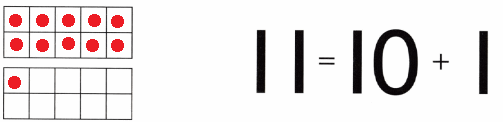
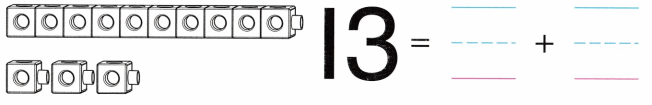
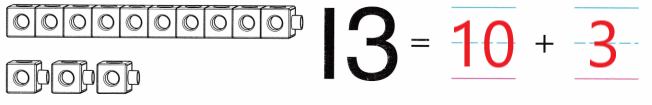
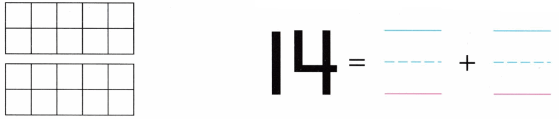
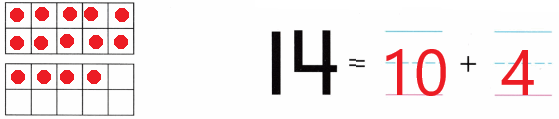
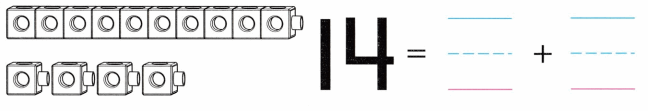
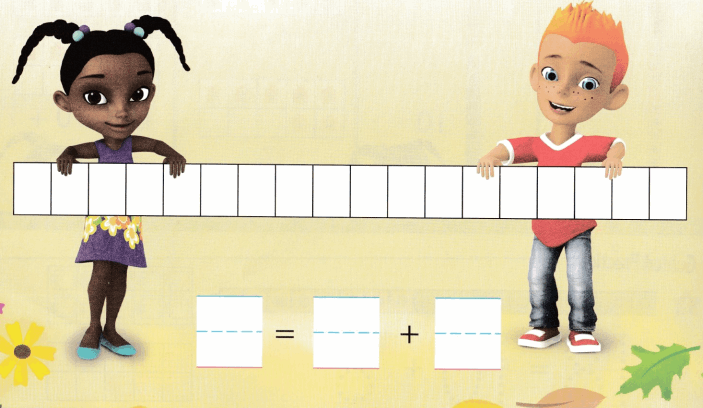
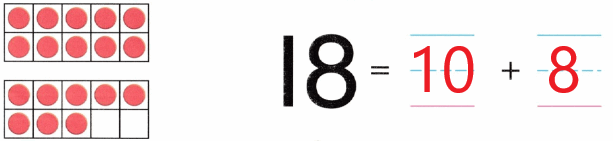
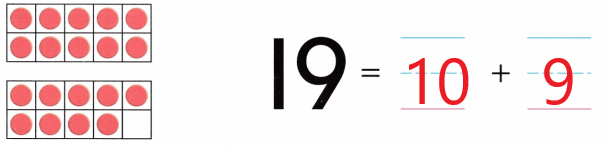
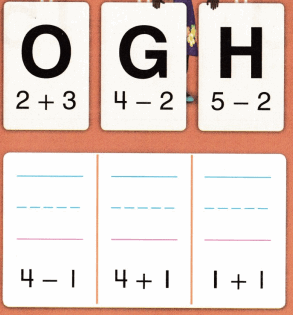
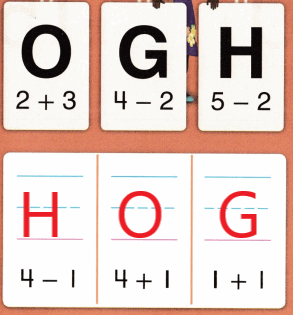
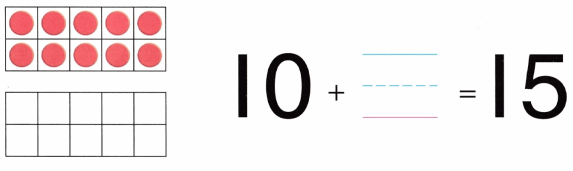
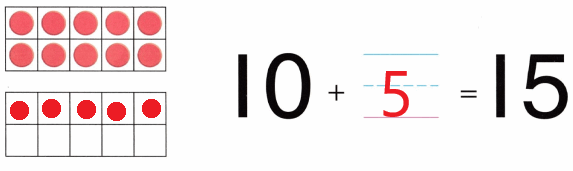
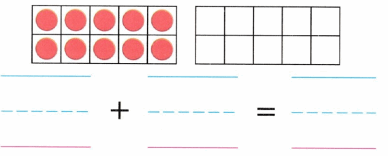
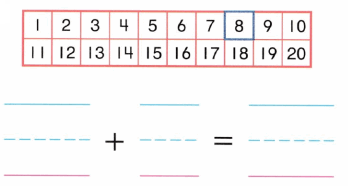
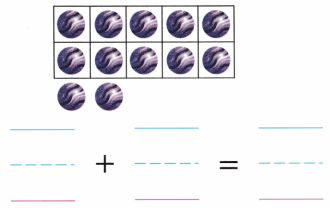
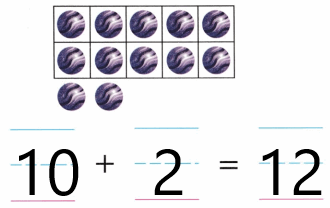
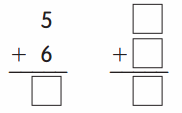
Question 1.
Answer:
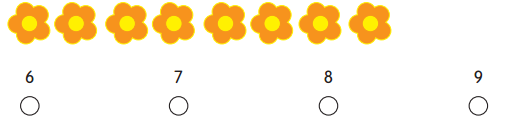
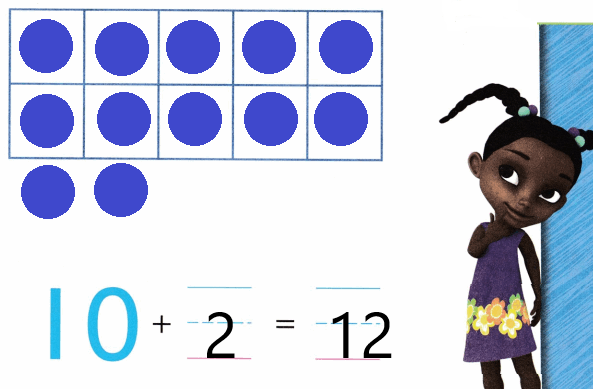
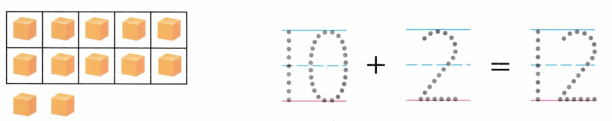
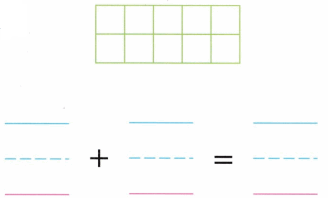
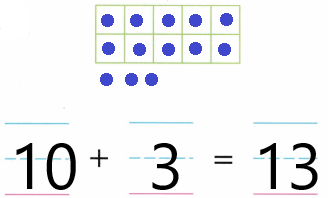
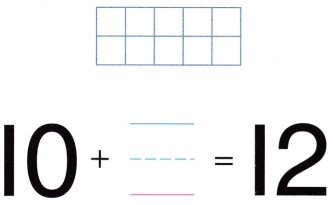
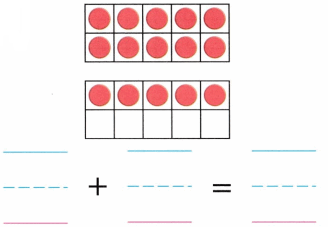
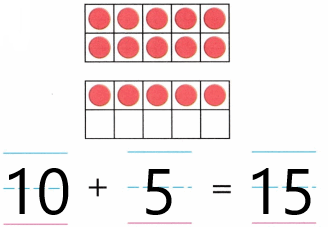
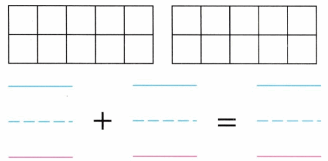
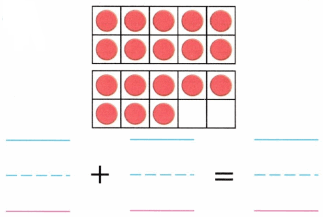
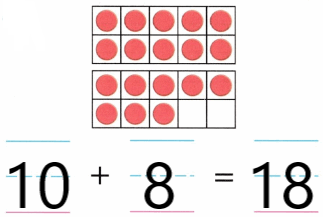
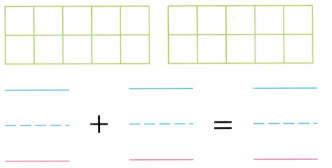
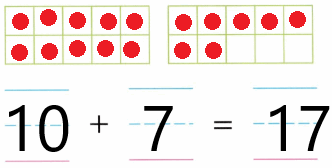
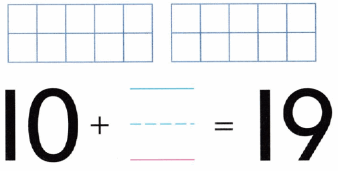
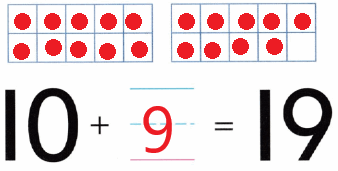
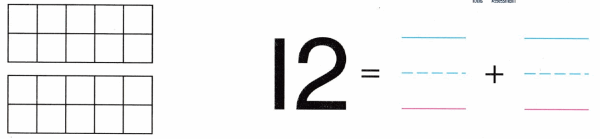
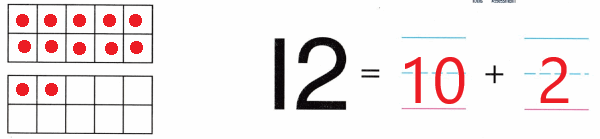
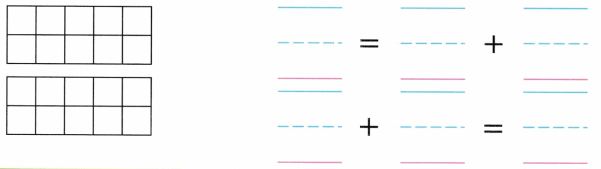
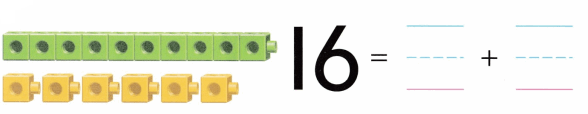
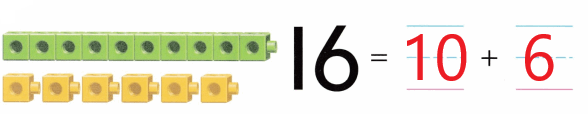
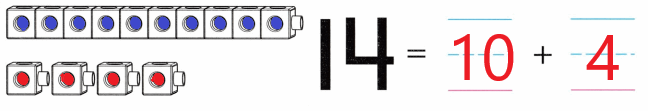
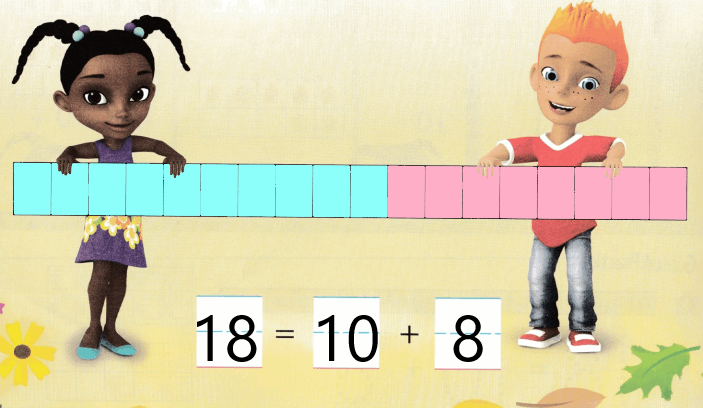
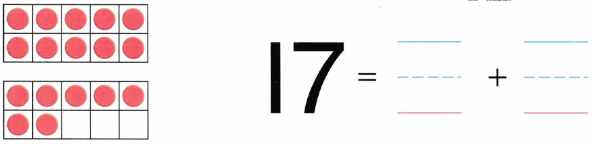
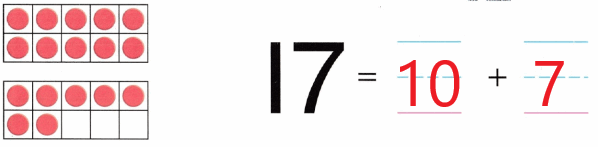
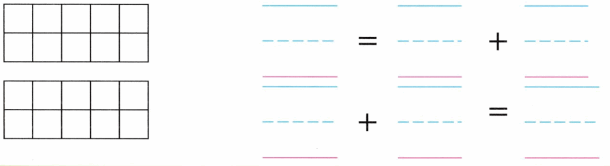
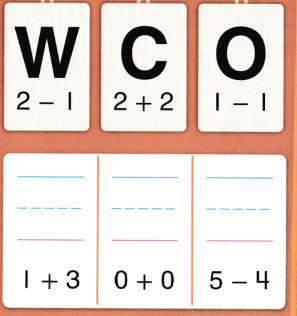
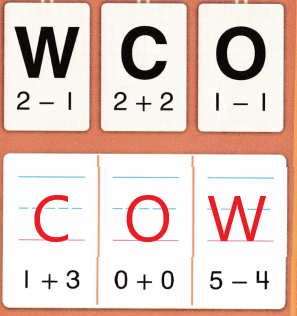
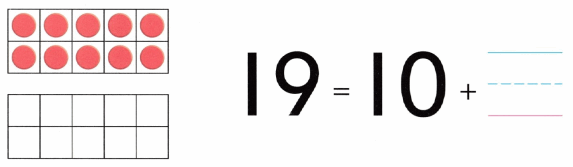
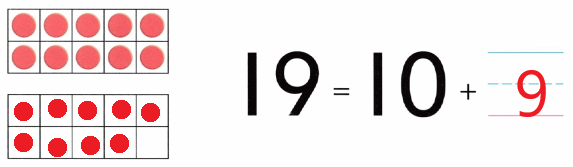
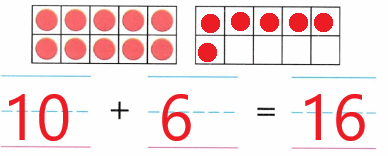
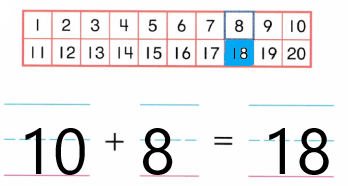
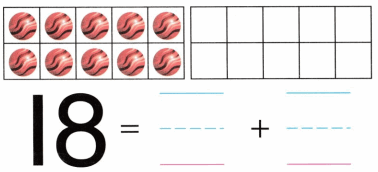
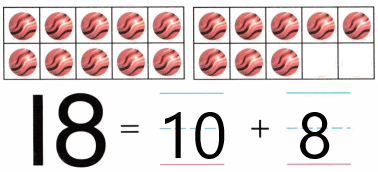
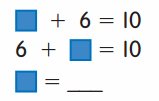
Question 2.
Answer:
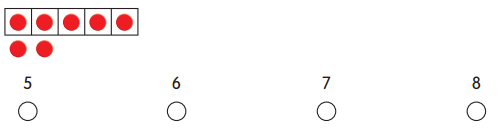
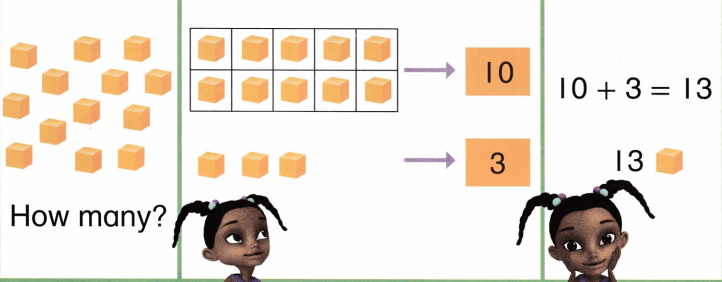
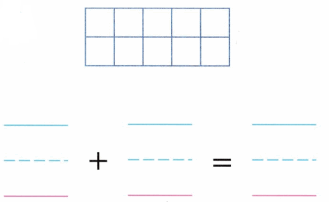
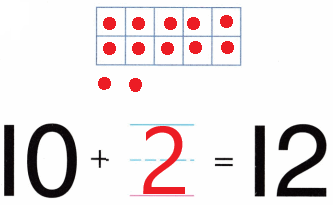
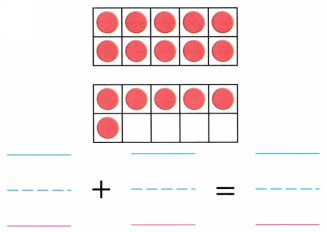
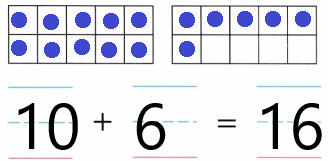
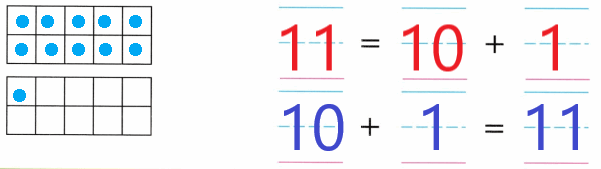
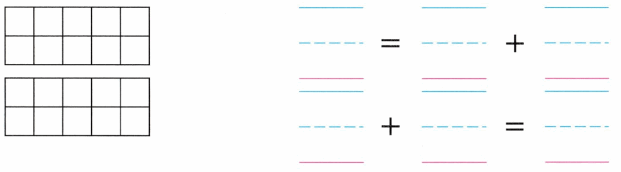
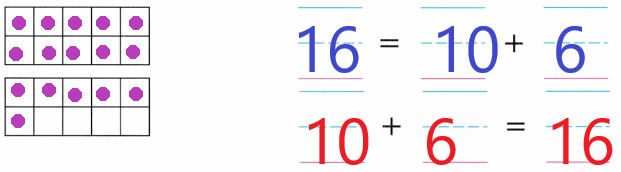
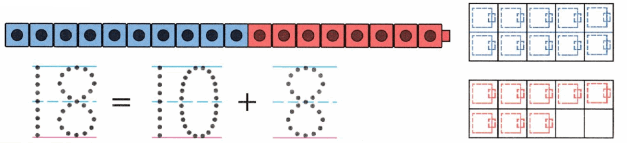
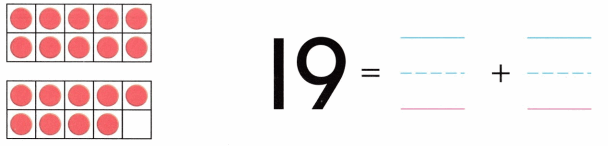
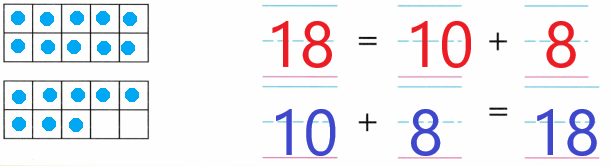
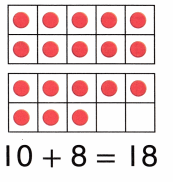
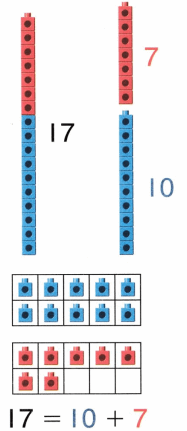
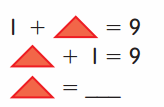
Question 3.
Answer:
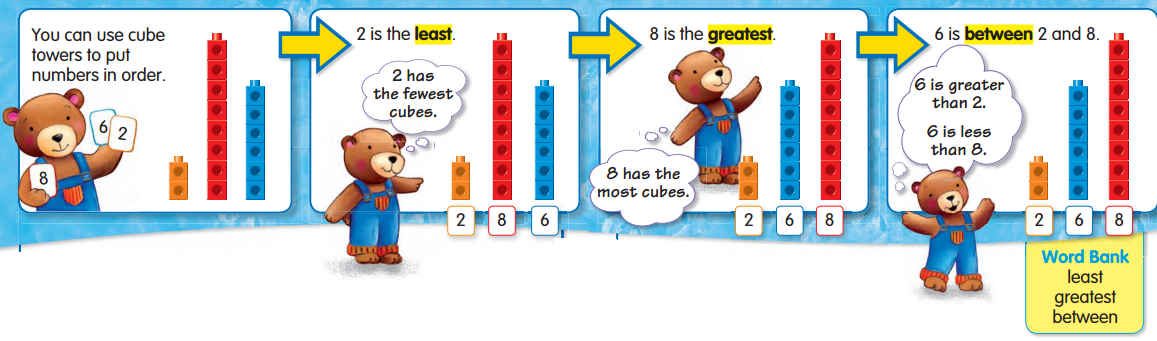
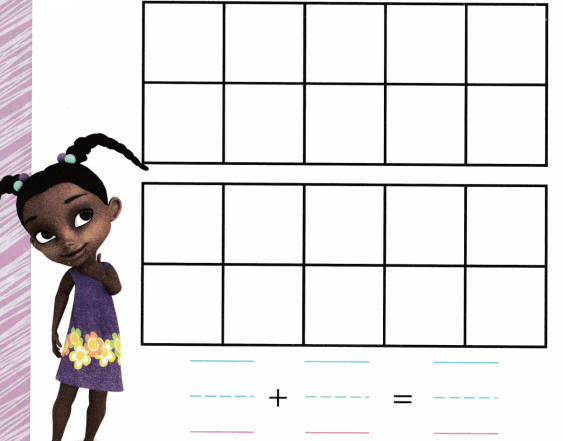
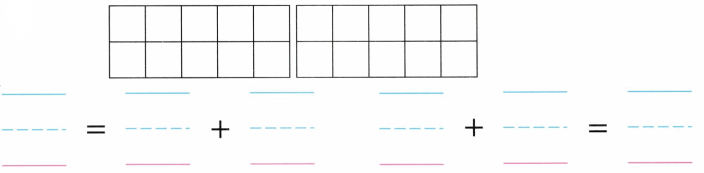
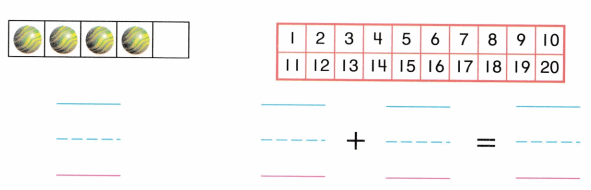
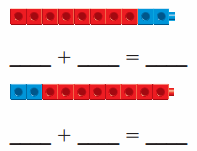
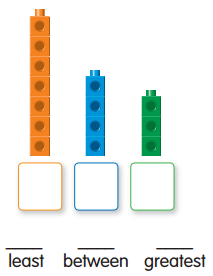
Guided Practice
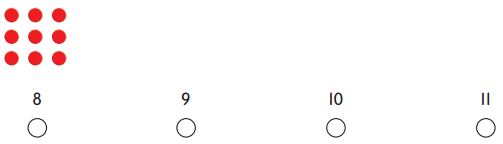
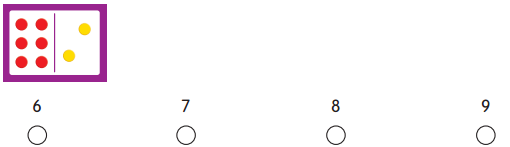
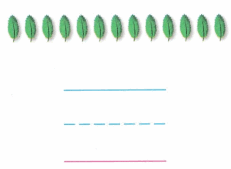
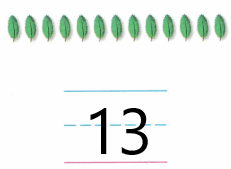
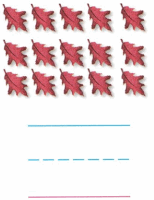
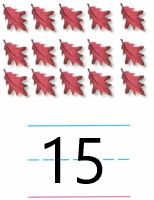
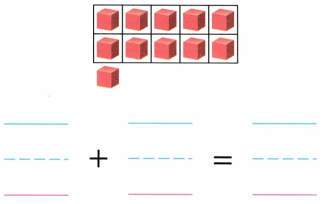
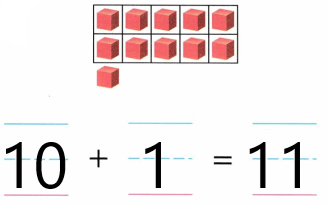
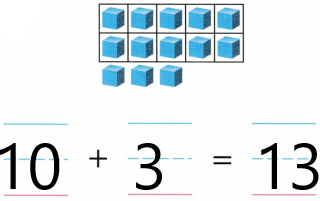
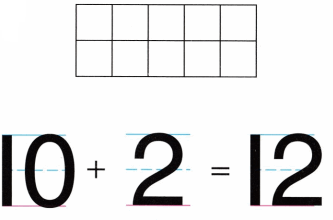
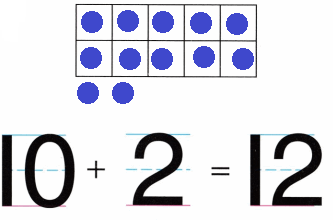
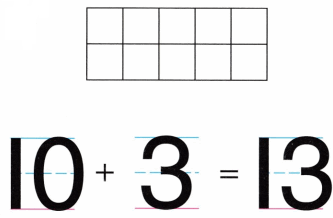
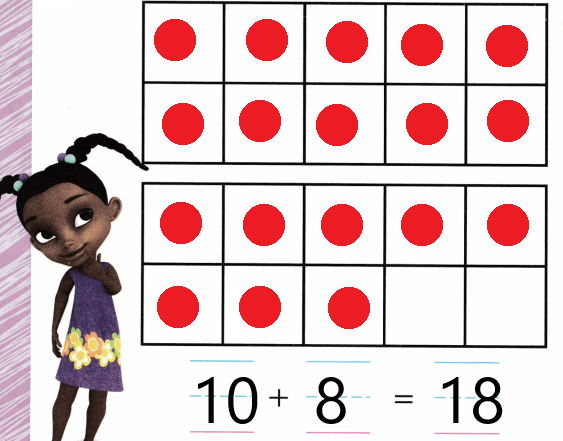
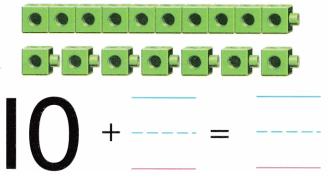
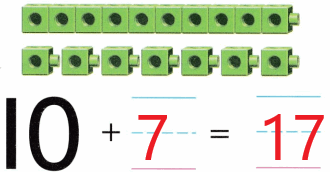
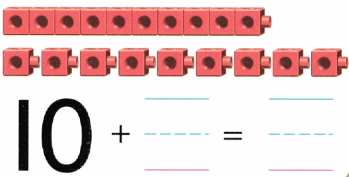
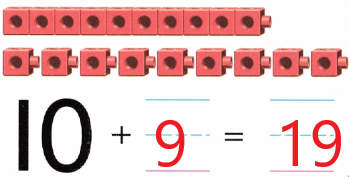
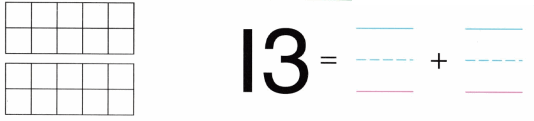
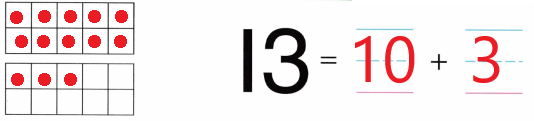
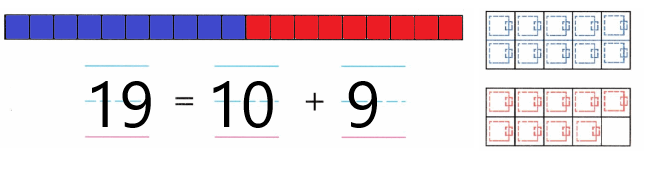
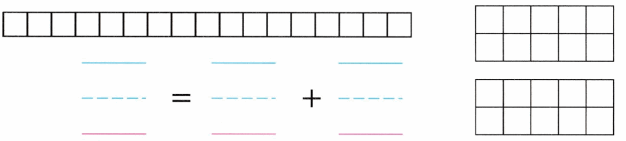
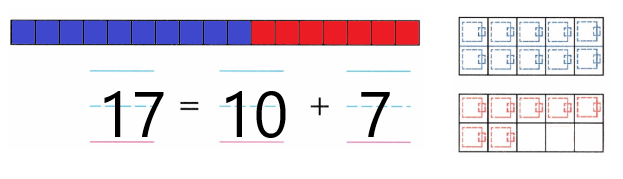
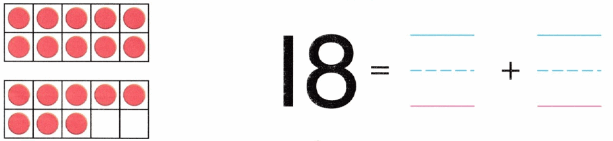
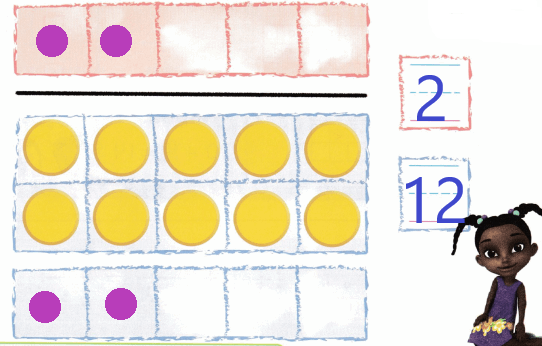
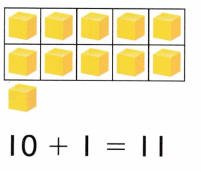
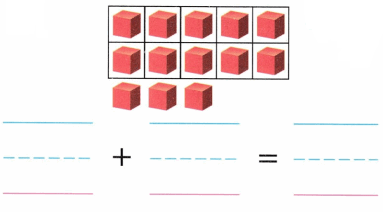
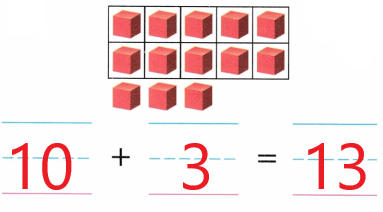
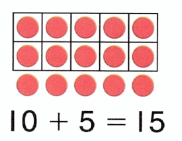
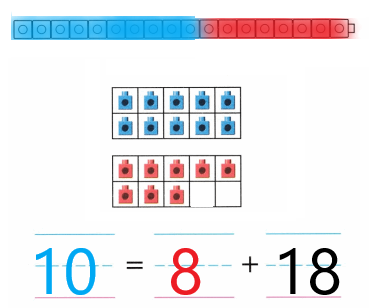
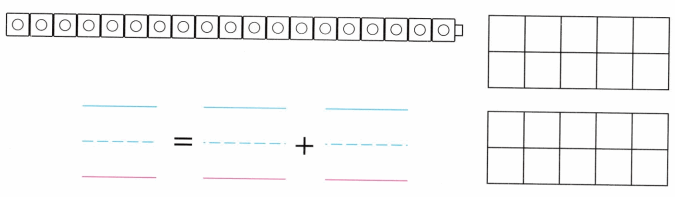
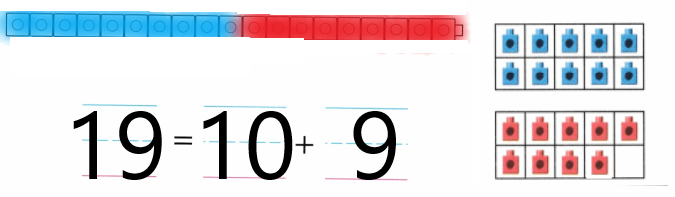
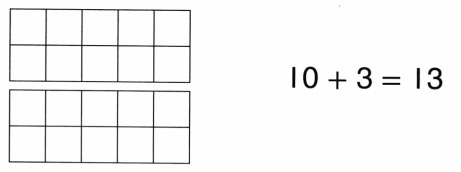
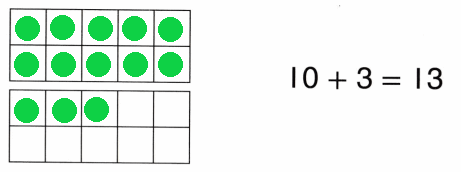
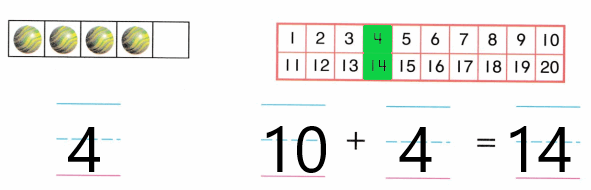
Count the cubes.
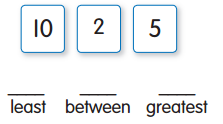
Write the numbers in order from least to greatest.
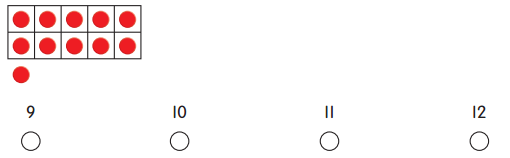
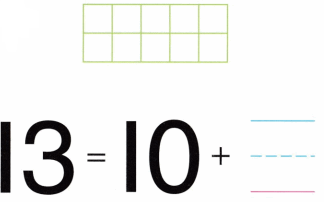
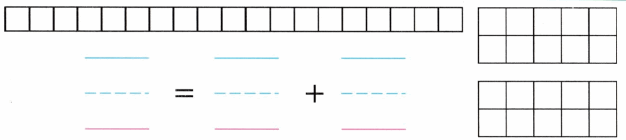
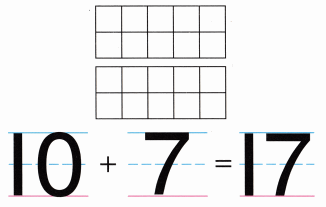
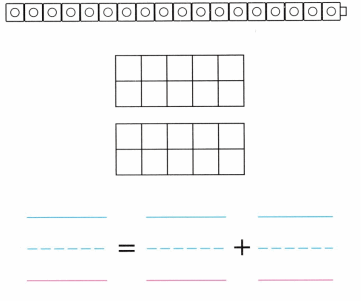
Question 1.
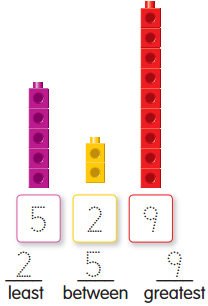
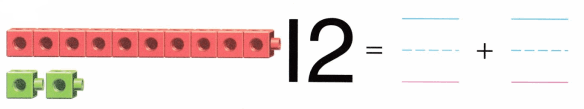
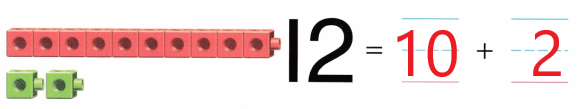
Question 2.
Answer:
Do you understand?
Question.
How can you tell which number is least?
Answer:

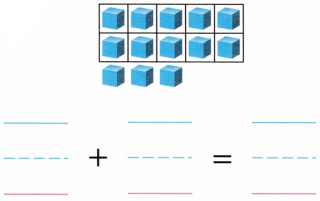
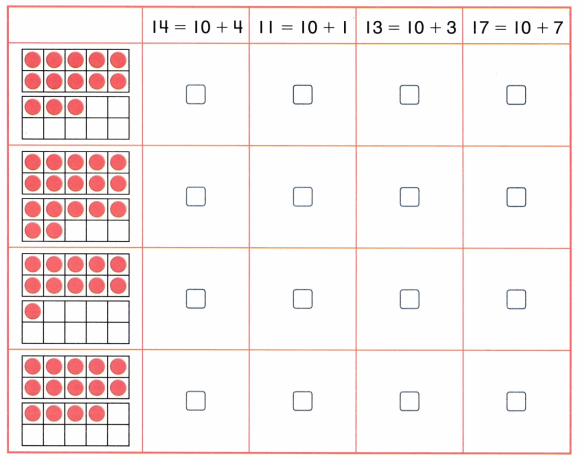
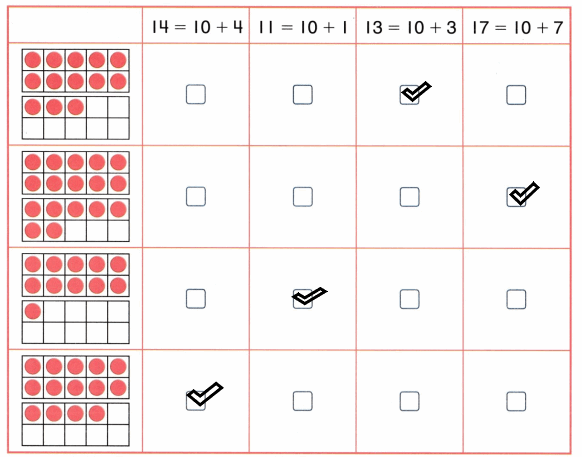
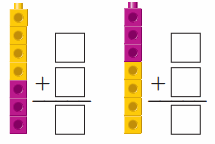
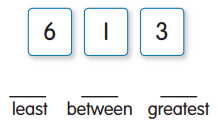
Independent Practice
Use cubes.
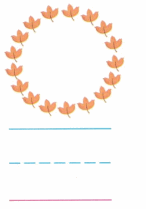
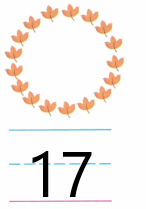
Write the numbers in order from least to greatest.
Question 3.
Answer:
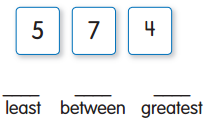
Question 4.
Answer:
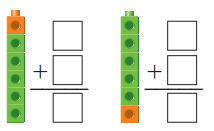
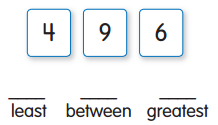
Question 5.
Answer:
Question 6.
Answer:
Reasoning Use cubes. Write who has the least.
Question 7.
Pat has 2 fewer cubes than Rosa. Jim has 4 cubes. Rosa has 1 more cube than Jim. ________ has the least
Answer:
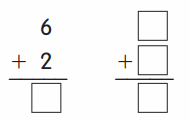
Problem Solving
Solve the problems below.
Question 8.
Jen draws 4 trees. Steve draws 8 trees. Luca draws 3 trees. Who draws the least number of trees? Draw a picture to solve.
______________
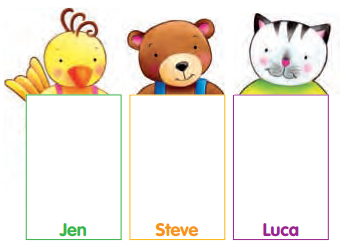
Answer:
Question 9.
Stacy paints 6 pots. Yin paints 2 pots. Mario paints 4 pots. Which shows the number of pots from least to greatest?
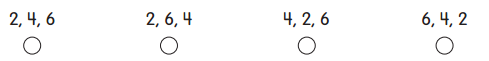
Answer:
Question 10.
Journal Choose three numbers less than 10. Put your numbers in order from greatest to least.
Answer: