Envision Math Grade 5 Answer Key Topic 18.1 Ordered Pairs

Envision Math 5th Grade Textbook Answer Key Topic 18.1 Ordered Pairs

Review What You Know

Vocabulary
Choose the best term from the box.
Envision Math Grade 5 Answers Topic 18.1 Ordered Pairs 1
Question 1.
(2, 5) is an example of a(n) ? .
Answer:

Question 2.
If you name a point (4, 6), 4 is the ? and 6 is the ? .
Answer:

Question 3.
A coordinate plane is made up of two intersecting ? .
Answer:

Basic Facts
Find each sum, difference, or product,
Question 4.
4 × 5
Answer:

Question 5.
7 × 8
Answer:

Question 6.
3 × 6
Answer:

Question 7.
8 + 6
Answer:

Question 8.
3 + 9
Answer:

Question 9.
5 + 7
Answer:

Question 10.
16 – 9
Answer:

Question 11.
8 – 6
Answer:

Question 12.
12 – 8
Answer:

Algebra
Question 13.
Evaluate 4x + 8 for x = 7
Answer:

Question 14.
Evaluate 51 ÷ y – 2 for y = 3
Answer:

Graphing Ordered Pairs
Writing to Explain Write an answer for the question.
Question 15.
Explain the steps you would follow to graph Point A (2, 3) on a coordinate grid .
Answer:

Ordered Pairs

How can you locate points on a coordinate grid?
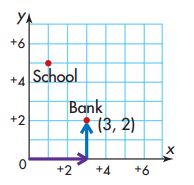
Envision Math Grade 5 Answers Topic 18.1 Ordered Pairs 2
Answer:
A coordinate grid makes it easy to locate a point on a map. Start at 0. Go 3 blocks east and then 2 blocks north. You will be at the bank.
An ordered pair names a point on a coordinate grid. The bank is at (3, 2)

Another Example
How do you graph a point on a coordinate plane?
Answer:
You know that graphs represent data. Now you will see how ordered pairs of numbers can represent points on a coordinate plane.
Graph Point R at (-4, -5)
Envision Math Grade 5 Answers Topic 18.1 Ordered Pairs 3
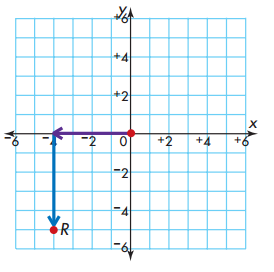
Step 1: Draw and label the x-axis and y-axis on grid paper.
Step 2: Move 4 units to the left of the origin.Then, move 5 units down.
Step 3: Mark a point and label it R.

Explain It
Question 1.
How would you locate the point (+4, -5) on a coordinate grid?
Answer:

Question 2.
If the location of point R above were changed to (-4, +5), would the point be above or below its current position?
Answer:

Question 3.
Suppose you want to graph the point (0, +5) on graph paper. When you start from the origin, do you move right 0 units or move up 0 units?
Answer:

A coordinate plane extends to include both positive and negative numbers. It has a horizontal x-axis and a vertical y-axis. The point at which the x-axis and y-axis intersect is called the origin.
Envision Math Grade 5 Answers Topic 18.1 Ordered Pairs 4

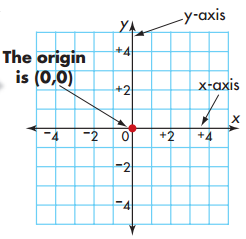
The first number in an ordered pair, the x-coordinate, names the distance to the right or left from the origin along the x-axis. The second number, the y-coordinate, names the distance up or down from the origin along the y-axis.
Envision Math Grade 5 Answers Topic 18.1 Ordered Pairs 5
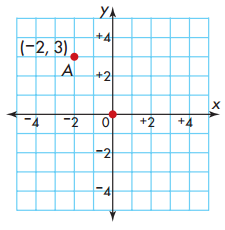
The ordered pair for Point A is (-2, 3).

Guided Practice

Do you know HOW?
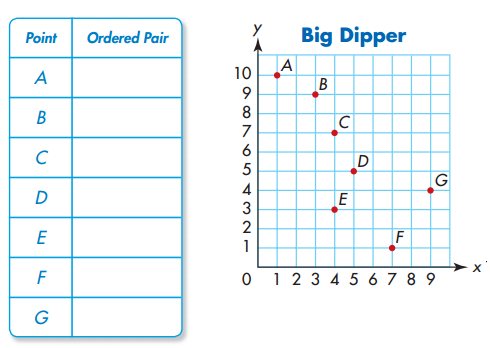
In 1 through 4, write the ordered pair for each point. Use the grid at the right.
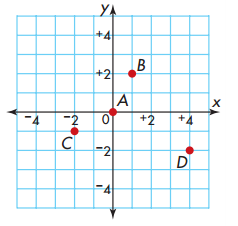
Envision Math Grade 5 Answers Topic 18.1 Ordered Pairs 6
Question 1.
A
Answer:

Question 2.
B
Answer:

Question 3.
C
Answer:

Question 4.
D
Answer:

Do you UNDERSTAND?
Question 5.
Writing to Explain Describe how to plot the ordered pair (-3, +4).
Answer:

Question 6.
What ordered pair names the origin of any coordinate plane?
Answer:

Question 7.
In the example above, name the ordered pair for a point that is 3 units directly above Point A.
Answer:

Independent Practice

In 8 through 13, write the ordered pair for each point. Use the grid at the right.
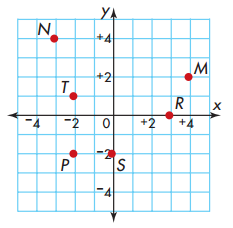
Envision Math Grade 5 Answers Topic 18.1 Ordered Pairs 7
Question 8.
M
Answer:

Question 9.
N
Answer:

Question 10.
P
Answer:

Question 11.
R
Answer:

Question 12.
S
Answer:

Question 13.
T
Answer:

In 14 through 19, graph and label each point on a grid.
Question 14.
H (2, +1)
Answer:

Question 15.
J (+5, +1)
Answer:

Question 16.
K(0, +5)
Answer:

Question 17.
E (+1, -3)
Answer:

Question 18.
F (+4, -5)
Answer:

Question 19.
G (-3, -4)
Answer:

Problem Solving

Geometry For 20 through 24, complete the table by listing the ordered pair for each vertex of the pentagon at the right.
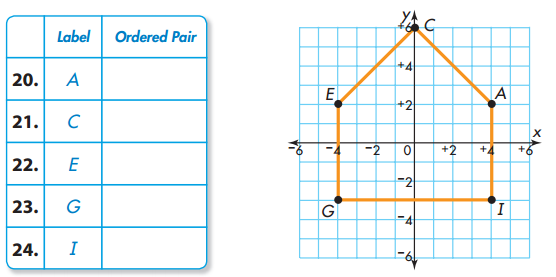
Envision Math Grade 5 Answers Topic 18.1 Ordered Pairs 8
Answer:

Question 25.
Algebra Which equation shows the relationship of the values in the table?
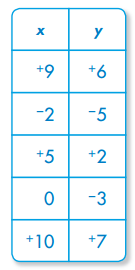
Envision Math Grade 5 Answers Topic 18.1 Ordered Pairs 9
A. y = x + 3
B. x = y – 3
C. y = x – 3
D. y = x
Answer:

Question 26.
A chessboard is similar to a coordinate grid. The pieces that look like horses are called knights. What letter-number combinations name the locations of the white knights?
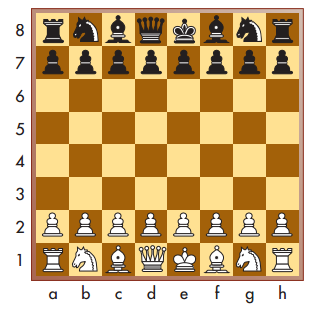
Envision Math Grade 5 Answers Topic 18.1 Ordered Pairs 10
Answer:

Question 27.
Writing to Explain
The streets in many cities in the United States are laid out in a coordinate grid. How is this helpful when finding locations in cities such as Los Angeles, California?
Answer:

Question 28.
In a class of 25 students, 15 are girls. Which does NOT show the part of the class that are girls?
A. \(\frac{3}{5}\)
B. 0.6
C. 60%
D. 0.3
Answer:

Stop and Practice

Find each difference.
Question 1.
6.7 – 0.921
Answer:

Question 2.
219.2 – 61.3
Answer:

Question 3.
2.5 – 1.054
Answer:

Question 4.
88.7 – 17.62
Answer:

Question 5.
1.17 – 0.362
Answer:

Question 6.
1.1 – 0.033
Answer:

In 7 through 13, solve each equation for c.
Question 7.
\(\frac{c}{8}\) = 9
Answer:

Question 8.
\(\frac{c}{16}\) = 2
Answer:

Question 9.
\(\frac{c}{17}\) = 5
Answer:

Question 10.
\(\frac{c}{2}\) = 2
Answer:

Question 11.
\(\frac{c}{30}\) = 3
Answer:

Question 12.
\(\frac{c}{10}\) = 13
Answer:

Question 13.
\(\frac{c}{7}\) = 6
Answer:

Find each difference. Estimate to check if the answer is reasonable.
Question 14.
Envision Math Grade 5 Answers Topic 18.1 Ordered Pairs 11
Answer:

Question 15.
734 ÷ 6
Answer:

Question 16.
Envision Math Grade 5 Answers Topic 18.1 Ordered Pairs 12
Answer:

Question 17.
723 ÷ 9
Answer:

Question 18.
10,648 ÷ 39
Answer:

Question 19.
Envision Math Grade 5 Answers Topic 18.1 Ordered Pairs 13
Answer:

Question 20.
Envision Math Grade 5 Answers Topic 18.1 Ordered Pairs 14
Answer:

Question 21.
6,203 ÷ 43
Answer:

Error Search Find each sum or difference that is not correct. Write it correctly and explain the error.
Question 22.
Envision Math Grade 5 Answers Topic 18.1 Ordered Pairs 15
Answer:

Question 23.
Envision Math Grade 5 Answers Topic 18.1 Ordered Pairs 16
Answer:

Question 24.
Envision Math Grade 5 Answers Topic 18.1 Ordered Pairs 17
Answer:

Question 25.
Envision Math Grade 5 Answers Topic 18.1 Ordered Pairs 18
Answer:

Question 26.
Envision Math Grade 5 Answers Topic 18.1 Ordered Pairs 19
Answer:

Number Sense
Estimating and Reasoning Write whether each statement is true or false. Explain your reasoning.
Question 27.
The sum of -8 and +12 equals -4.
Answer:

Question 28.
The quotient of 5,763 ÷ 8 is between 700 and 800.
Answer:

Question 29.
The difference of 25,980 – 15,980 is less than 10,000.
Answer:

Question 30.
The product of 8 and 5.943 is closer to 48 than 40.
Answer:

Question 31.
The sum of 5\(\frac{7}{10}\) and 3\(\frac{3}{4}\) is greater than 9.
Answer:

Question 32.
The k in the equation 13k = 39 is equal to 3.
Answer:

Envision Math Grade 5 Answer Key Topic 19 Reteaching

Envision Math 5th Grade Textbook Answer Key Topic 19 Reteaching

Reteaching

Set A, pages 420-422

Students were asked to name their favorite seasons. Make a bar graph to show the results.
Envision Math Grade 5 Answers Topic 19 Reteaching 1

Remember that a bar graph or a picture graph can be used to compare data that shows how many or how much. In a picture graph, each symbol represents a certain amount in the data.
Question 1.
Students were asked to name their favorite flower. Make a bar graph to show the results.
Envision Math Grade 5 Answers Topic 19 Reteaching 2
Answer:

Set B, pages 424-425

David made a histogram to show how many books his class had purchased in the last year.
Envision Math Grade 5 Answers Topic 19 Reteaching 3
Using the histogram, find the number of students who purchased 3-5 books. The bar with the 3-5 interval has a height of 8. The number of students is 8.

Remember that histograms are a type of bar graph that has no space between the bars and the bars show equal intervals.
Use the histogram at the left to answer the following questions.
Question 1.
How many students were surveyed?
Answer:

Question 2.
How many students had bought more than 5 books?
Answer:

Question 3.
What fraction of the students bought 9, 10, or 11 books?
Answer:

Set C, pages 426–428

A group of 100 students were asked to name their favorite type of television program. Make a circle graph to show the results.
Envision Math Grade 5 Answers Topic 19 Reteaching 4
Comedy = 25 out of 100 = \(\frac{1}{4}\)
Sports = 50 out of 100 = \(\frac{1}{2}\)
Drama = 10 out of 100 = \(\frac{1}{10}\)
Other = \(\frac{15}{100}\) = \(\frac{3}{20}\)
Draw a circle with sectors for \(\frac{1}{2}\), \(\frac{1}{4}\), and \(\frac{1}{100}\) and label those sectors with the program type. The remaining sector shows \(\frac{3}{20}\) or Other.

Remember a circle graph shows the whole amount (100%) and each sector represents a part of the whole amount.
Jill spent a total of 30 hours exercising last month: Jogging: 15 hours; Cycling: 10 hours; Swimming: 5 hours.
Envision Math Grade 5 Answers Topic 19 Reteaching 5
Question 1.
Copy the circle graph and label each sector with the activity and fraction.
Answer:

Question 2.
What fraction represents the part of the day Jill spent cycling?
Answer:

Set D, pages 430-431

Students were asked to name their favorite animal. Make a bar graph to show the results.
Envision Math Grade 5 Answers Topic 19 Reteaching 6

Remember that making a graph makes it easy to visualize data and answer questions about the data.
Envision Math Grade 5 Answers Topic 19 Reteaching 7
Question 1.
Make a line graph of the data.
Answer:

Question 2.
Which month has a snowfall
Answer:

Question 3.
times as great as December?
Answer:

Set E, pages 432-433

Find the mean of this data set:
2, 3, 8, 3, 5, 6, 1
The mean is an average. To find the mean, add the data and divide by the number of data.
(2 + 3 + 8 + 3 + 5 + 6 + 1) ÷ 7 = 28 ÷ 7 = 4
The mean is 4.

Remember that the mean is an average. You must add the data and divide by the number of addends.
Question 1.
5, 4, 1,3, 1, 10
Answer:

Question 2.
6, 9, 5, 2, 8
Answer:

Question 3.
4, 2, 2, 5, 3, 3, 2
Answer:

Set F, pages 434-435

Find the median, mode, and range for this set of data: 10, 15, 20, 12, 10

To find the median, list the data in order from least to greatest and find the middle value.
10, 10, 12, 15, 20 The median is 12.

To find the mode, list the data in order from least to greatest and find the value that occurs most often.
10, 10, 12, 15, 20 The mode is 10.

To find the range, subtract the least value from the greatest value.
20 – 10 = 10 The range is 10.

Remember that if there is an even number of data, you must add the two middle numbers when the data are ordered from least to greatest and divide by 2 to find the median.
Question 1.
Find the median of this data set:
27.5 27 30 29.5
Answer:

Question 2.
Find the mode of this data set:
12, 6, 9, 5, 8, 12, 8, 1,4, 12, 6
Answer:

Question 3.
Find the range of this data set:
87, 84, 90, 75, 100, 88
Answer:

Set G, pages 436-437

Judy can pick either a hamburger or a chicken sandwich and then either a coleslaw, potato salad, or a fruit salad. How many different lunch combinations can she have?
Draw a tree diagram.
Envision Math Grade 5 Answers Topic 19 Reteaching 8
There are 6 possible combinations, so Judy has a choice of 6 different lunches.

Remember that when you make a tree diagram, start with 1 item and list all the possible combinations with it. Continue with all the items.
Question 1.
Make a tree diagram to show the sample space for tossing a number cube and then tossing a quarter.
Answer:

Question 2.
Make a tree diagram to show the results of choosing among tuna, cheese, and turkey sandwiches, and milk and juice drinks.
Answer:

Set H, pages 438-440

You spin the spinner once. Find P (landing in a green section).
Envision Math Grade 5 Answers Topic 19 Reteaching 9
Probability = \(\frac{\text { number of favorable outcomes }}{\text { number of possible outcomes }}\)
So, P (green) = \(\frac{3}{6}\) = \(\frac{1}{2}\)

Remember that when you express a probability as a fraction, always write the fraction in simplest form.

Use the letters in MATHEMATICS. Each letter is written on a separate piece of paper and the pieces are put in a bag.
Find the probability of choosing each letter or letters out of the bag.
Question 1.
P (a consonant)
Answer:

Question 2.
P (the letter A)
Answer:

Question 3.
P (not the letter A)
Answer:

Set I, pages 442-443

To solve a simpler problem, follow these steps:
Step 1:
Break apart or change the problem into one that is simpler to solve.

Step 2:
Draw a picture or use objects to look for a pattern to solve the simpler problem.

Step 3:
Use the answers to the simpler problem to solve the original problem.

Four people shake hands with each other once. How many handshakes are there in all?
Use A, B, C, D to represent the people.
AB, AC, AD BC, BD, CD
There are 6 handshakes.

Remember that you can draw a picture or use objects to look for a pattern in finding the relationship between the simpler problem and the original problem.
Question 1.
How many different teams of 2 people can be chosen from 4 people?
Answer:

Question 2.
How many different teams of 3 people can be chosen from 5 people?
Answer:

Question 3.
What is the sum of the angles of an octagon?
Answer:

Envision Math Grade 5 Answer Key Topic 19 Test Prep

Envision Math 5th Grade Textbook Answer Key Topic 19 Test Prep

Test Prep

Question 1.
The histogram shows the results from a survey asking people how many plays they have seen in the last year. How many people have seen more than 3 plays? (19-2)
Envision Math 5th Grade Textbook Answer Key Topic 19 Test Prep 1
A. 26
B. 15
C. 11
D. 8
Answer:

Question 2.
The music teacher is choosing two students out of 10 to sing a duet in the musical. How many different pairs of students must try out if she wants to try every possible pair? (19-9)
A. 50
B. 45
C. 20
D. 12
Answer:

Question 3.
James is drawing the picture graph below to show the number of license plates from each state he saw on a recent trip. He saw 15 Arizona license plates. Which picture should he draw for Arizona? (19-1)
Envision Math 5th Grade Textbook Answer Key Topic 19 Test Prep 2
Answer:

Question 4.
The shoe sizes of the starting players on the girls’ basketball team are listed below. What is the median of these numbers? (19-6)
7, 6, 5, 6, 8
A. 5
B. 6
C. 7
D. 8
Answer:

Question 5.
According to the circle graph below, about what fraction of the t-shirts sold were x-large? (19-3)
Envision Math 5th Grade Textbook Answer Key Topic 19 Test Prep 3
A. \(\frac{1}{3}\)
B. \(\frac{1}{4}\)
C. \(\frac{1}{5}\)
D. \(\frac{1}{6}\)
Answer:

Question 6.
The table shows the heights of a group of friends. What is the mean height of the group in inches? (19-5)
Envision Math 5th Grade Textbook Answer Key Topic 19 Test Prep 4
A. 61
B. 60
C. 59
D. 58
Answer:

Question 7.
A college student plans to take biology, algebra, and literature in the morning. Each letter represents the first letter of each class. Which list below shows all the different orders that these three classes can be taken? (19-7)
Answer:
A. BAL, BAB, LAB
B. BAL, LAB, ABL, LBA
C. BAL, BLA, ALB, LAB, ABL
D. BAL, BLA, ALB, ABL, LAB, LBA
Answer:

Question 8.
The cards shown are placed in a bag and one is drawn without looking. What is the probability Bobby’s name is drawn? (19-8)
Envision Math 5th Grade Textbook Answer Key Topic 19 Test Prep 5
A. \(\frac{1}{8}\)
B. \(\frac{2}{8}\)
C. \(\frac{3}{8}\)
D. \(\frac{3}{5}\)
Answer:

Question 9.
An airline company is making a graph to display the number of each type of ticket they have available on a flight including first class, business class and economy. Which type of graph would be best to display the data? (19-4)
A. Bar or picture graph
B. Line plot
C. Circle graph
D. Line graph
Answer:

Envision Math Grade 5 Answer Key Topic 19.9 Problem Solving

Envision Math 5th Grade Textbook Answer Key Topic 19.9 Problem Solving

Problem Solving

Solve a Simpler Problem
Owen needs to read 2 books from a list of 6 books. How many different combinations of books are possible?
Envision Math 5th Grade Textbook Answers Topic 19.9 Problem Solving 1
Answer:
Follow these steps to solve a simpler problem.

  1. Break apart or change the problem into one that is simpler.
  2. Solve the simpler problem.
  3. Use the answers to the simpler problem to solve the original problem.

Guided Practice

Do you know HOW?
Question 1.
Draw a picture to show the number of combinations of pairs for 5 books.
Answer:

Question 2.
Think of extending the table at the top to find the number of pairs with 7 books. What number would you add to 15 to find the number of pairs? How many pairs would there be for 7 books?
Answer:

Do you UNDERSTAND?
Question 3.
Writing to Explain Is it easier to use the table or to draw a picture as the number of books increases?
Answer:

Question 4.
Write a Problem Write a real-world problem that can be solved by solving a simpler problem.
Answer:

Independent Practice

Solve each problem.
Question 5.
Continue the pattern in the book problem above. How many pairs of books would there be for 8 books? 9 books? 10 books?
Answer:

Question 6.
Find the number of degrees in a hexagon. HINT: Divide the hexagon into triangles.
Envision Math 5th Grade Textbook Answers Topic 19.9 Problem Solving 2
a. How many triangles are formed?
b. How many degrees are in each triangle?
c. What is the total number of degrees in the hexagon?
Answer:

Question 7.
Using the same strategy in Problem 6, what is the total number of degrees in a pentagon? An octagon?
Answer:

Use letters to represent the books.
Envision Math 5th Grade Textbook Answers Topic 19.9 Problem Solving 3

Look for a pattern.
Find the pattern. Continue the pattern to 6 books.
Envision Math 5th Grade Textbook Answers Topic 19.9 Problem Solving 4
There are 15 different possible pairs.

Question 8.
Juanita tossed 3 number cubes, and these digits came up.
Envision Math 5th Grade Textbook Answers Topic 19.9 Problem Solving 5
If each of the numbers 2, 1 and 4 is used only once to form a 3-digit number, which shows all the possible 3-digit numbers?
A. 214, 421, 142
B. 214, 124, 412, 421
C. 214, 241, 142, 412, 124
D. 214, 241, 142, 124, 412, 421
Answer:

Question 9.
Jill has 3 colored vases to arrange on a shelf
Envision Math 5th Grade Textbook Answers Topic 19.9 Problem Solving 6
Let B stand for blue, O for orange, and G for green. Which list shows all the possible arrangements of the vases?
A. BOG, OBG, GOB
B. BOG, OBG, GOB, GBO
C. BOG, OBG, GOB, GBO, OGB
D. BOG, OBG, GOB, GBO, OGB, BGO
Answer:

Question 10.
George was choosing his clothes for the next day. In his closet he had 2 ties, 5 shirts, 3 trousers, and 2 belts. How many different ways could George choose a tie, shirt, trousers, and belt?
Answer:

Question 11.
The McMillan family wanted to buy a new vehicle. They could choose a van or a car; a black, silver, or white exterior; and a tan or black interior. How many different vehicles can they buy?
Answer:

Question 12.
After seeing a movie, 2 friends stopped for frozen yogurt. Three flavors were available in small, medium, and large sizes. How many different combinations of flavors and sizes are possible?
Answer:

Question 13.
Algebra Draw a picture and write an equation to solve.
Niko had 17\(\frac{1}{3}\) ft of fencing. He uses 5\(\frac{2}{3}\) ft to finish a job. How many feet of fencing does Niko have now? Let f = feet of fencing left?
Answer:

Envision Math Grade 5 Answer Key Topic 19.8 Writing Probability as a Fraction

Envision Math 5th Grade Textbook Answer Key Topic 19.8 Writing Probability as a Fraction

Writing Probability as a Fraction

What is the probability of an event?
Answer:
Reuben writes each letter of his name on a separate piece of paper and puts them in a bag. He chooses one piece of paper from the bag without looking.
Envision Math Grade 5 Answer Key Topic 19.8 Writing Probability as a Fraction 1
The probability of an event is a number that describes the chance the event will occur.

Another Example
What is the probability of two events happening together?
Answer:
Eva puts the letters of her name into a bag and chooses a letter out of the bag without looking. She puts the letter back into the bag and chooses again without looking. What is the probability that Eva chooses an A both times?
Draw a tree diagram.
Envision Math Grade 5 Answer Key Topic 19.8 Writing Probability as a Fraction 2

Find the probability.
Answer:
There are a total of 9 possible outcomes when the two letters are chosen and the first is replaced. One of the outcomes is favorable because only one of the outcomes has an A both times.
The probabilty of any event ranges from 0 to 1.
Envision Math Grade 5 Answer Key Topic 19.8 Writing Probability as a Fraction 3
P(A, A) = \(\frac{1}{9}\)
The probability that Eva chooses an A both times is \(\frac{1}{9}\) .

Explain It
Question 1.
Use the tree diagram above to find the probability of choosing the same letter twice. Hint: Look for pairs of outcomes with the same letter.
Answer:

Question 2.
If an event has a probability of \(\frac{3}{4}\), is it less likely, more likely, equally likely, impossible, or certain to occur?
Answer:

Probability of an event = \(\frac{\text { number of favorable outcomes }}{\text { total number of possible outcomes }}\)

What is the probability that Reuben will choose the letter B?
There is 1 favorable outcome out of 6 possible outcomes, R, E, U, B, E, or N. The outcomes are equally likely (have the same chance of occurring). The probability of choosing the letter B can be written as P(B).
P(B) = \(\frac{1}{6}\)
The probability that Reuben chooses a B out of the bag is \(\frac{1}{6}\).

What is the probability that Reuben will choose the letter E?
There are 2 favorable outcomes out of 6 possible outcomes (since E appears twice).
P(E) = \(\frac{2}{6}\) = \(\frac{1}{3}\)
The probability that Reuben chooses an E out of the bag is \(\frac{1}{3}\) or P(E) = \(\frac{1}{3}\).

Guided Practice

Do you know HOW?
For 1 through 4, use the spinner shown
Envision Math Grade 5 Answer Key Topic 19.8 Writing Probability as a Fraction 4
Question 1.
Find P(blue).
Answer:

Question 2.
Find P(yellow).
Answer:

Question 3.
Find P(red).
Answer:

Question 4.
Find P(green).
Answer:

Do you UNDERSTAND?
Question 5.
Writing to Explain
In the example above, is it likely, unlikely, impossible, or certain that Reuben draws a B?
Answer:

Question 6.
What is the probability that Reuben will NOT draw an R?
Answer:

Independent Practice

Question 7.
Write each letter of your first name on a separate small sheet of paper. Put each piece into a box. Do an experiment where you pick one letter and replace it each time. Do this 10 times. Record the number of times you pick each letter, and then write the probability as a fraction.
Answer:

For 8 through 12, suppose you toss a quarter and a penny.
Envision Math Grade 5 Answer Key Topic 19.8 Writing Probability as a Fraction 5
Question 8.
Make a tree diagram to show the possible outcomes.
Answer:

Question 9.
Find P(one head).
Answer:

Question 10.
Find P(two heads).
Answer:

Question 11.
Find P(quarter heads, penny tails)
Answer:

Question 12.
Find P(no heads)
Answer:

Question 13.
When a number cube is tossed, there are 6 possible outcomes (1,2, 3, 4, 5, or 6). If the cube is tossed twice and the outcomes are added, the possible sums are from 2 through 12.
Answer:

Copy the table and give the probability of each sum.
Envision Math Grade 5 Answer Key Topic 19.8 Writing Probability as a Fraction 6
Question 14.
Which sum (or sums) has the greatest probability of occurring?
Answer:

Question 15.
Which sum (or sums) has the least probability of occurring?
Answer:

Problem Solving

Question 16.
Geometry
Kendra tosses a colored cube. Half of the sides of the cube are red, \(\frac{1}{3}\) of the sides are blue, and one side is green. What is the probability that the cube will land on a color other than red when tossed?
Answer:

Question 17.
Mrs. Pierre bought 150 pencils to give to her students. She has three classes with 27, 25, and 23 students each. She wants every student to get the same number of pencils. How many pencils should she give to each student?
Answer:

Question 18.
Think About the Process
Jorge put colored cards into a bag. Two of the cards were green, three were red, one was orange, two were blue, and two were purple. Jorge wants to find the probability that he will pull an orange card from the bag. What step does Jorge take to determine the number of possible outcomes?
A. Count the number of orange cards.
B. Count the number of different colored cards.
C. Count the total number of cards in the bag.
D. Count the number of cards that are not orange.
Answer:

Question 19.
Carlita buys 3 beanbag throws for $1.00. What is the probability she will toss one beanbag through a hole in the top row of this game? Assume Carlita always throws a beanbag into a hole.
Envision Math Grade 5 Answer Key Topic 19.8 Writing Probability as a Fraction 7
Answer:

Question 20.
How many parts of each color should there be to make sure that it is equally likely this spinner will land on each of 3 different colors?
Envision Math Grade 5 Answer Key Topic 19.8 Writing Probability as a Fraction 8
Answer:

Algebra Connection

Which Equation is True?
Answer:
Remember that an equation is a number sentence that uses an equal sign to show that two expressions are equal. Both of the following are equations.
8 + 2 = 10
x + 25 = 100
The first equation is true. You don’t know if an algebraic equation is true or false until you replace the variable with a number.
If x = 75, then x + 25 = 100 is a true equation.

Example:
If m = 25, which equation is true?
2 + m = 30
m – 20 = 5
In the first equation, if you replace m with 25, the result is 2 + 25 = 30. This equation is false.
In the second equation if you replace m with 25, the result is 25 – 20 = 5. This equation is true.

Decide which equation is true for each replacement of the variable.
Question 1.
If x = 20, which equation is true?
Answer:

Question 2.
If y = 100, which equation is true? y – 80 = 180 or y ÷ 2 = 50
Answer:

Question 3.
If x = 50, which equation is true? x + 50 = 75 or \(\frac{x}{10}\) = 5
Answer:

Question 4.
If x = 80, which equation is true? 40x = 3,200 or \(\frac{x}{4}\) = 2
Answer:

Question 5.
If z = 200, which equation is true? 200 – x = 200 or x + 100 = 300
Answer:

Question 6.
If x = 70, which equation is true? 6x = 420 or x + 7 = 63
Answer:

Question 7.
If x = 0, which equation is true? 50x = 50 x + 7 = 7
Answer:

Question 8.
If x = 1, which equation is true? 40x = 40 or 40 + x = 40
Answer:

Question 9.
If a teacher has 32 students and divides them into teams of 4, which equation could be used to find how many students will be on each team? Let x represent the number of students on each team.
\(\frac{32}{4}\) = x
4 + x = 32
\(\frac{32}{x}\) = 4
4 × 32 = x
Answer:

Envision Math Grade 5 Answer Key Topic 19.7 Outcomes

Envision Math 5th Grade Textbook Answer Key Topic 19.7 Outcomes

Outcomes

How can tree diagrams help you list possible outcomes?
How many outcomes are possible when spinning a spinner once and then tossing a coin twice?
Envision Math 5th Grade Answer Key Topic 19.7 Outcomes 1
Answer:

Question.
Use a tree diagram to list all possible outcomes.
Answer:
A tree diagram is a diagram used to organize outcomes of an experiment.

Guided Practice

Do you know HOW?
In 1 through 3, list the possible outcomes.
Question 1.
Tossing a number cube
Answer:

Question 2.
Spinning a spinner divided into white, blue, black, and purple
Answer:

Question 3.
Tossing an even number on a number cube
Answer:

Do you UNDERSTAND?
Question 4.
Writing to Explain
In the example above, how would your tree diagram change if the spinner had 4 colors? How many possible outcomes would there be?
Answer:

Question 5.
Write a multiplication equation to find the possible outcomes of tossing a number cube and spinning a spinner with 4 different colors.
Answer:

Independent Practice

Question 6.
Two spinners are spun. Copy and complete the tree diagram to show the possible outcomes.
Envision Math 5th Grade Answer Key Topic 19.7 Outcomes 2
Answer:

Question 7.
Josh and Susan are running for class president. Mark, Maria, Lee, and Eva are running for vice-president. How many possible outcomes are there for electing a president and a vice president?
Answer:

A tree diagram shows the sample space, which is the set of all possible outcomes.
Envision Math 5th Grade Answer Key Topic 19.7 Outcomes 3

You can also find the number of outcomes by multiplying.
Envision Math 5th Grade Answer Key Topic 19.7 Outcomes 4
There are 8 possible outcomes.

Problem Solving

Question 8.
On four tests, Justin scored 90, 85, 90, and 95. What is the mean score of the four tests?
Answer:

Question 9.
Steve’s dog is 10 lb heavier than Marsha’s dog. Together, the dogs weigh 42 lb. How much does each dog weigh?
Answer:

Question 10.
John, Andy, and Miguel run in the first race. Sharon, Marie, and Mona run in the second race. How many different outcomes are possible for the winning pairs?
A. 3
B. 6
C. 9
D. 12
Answer:

Question 11.
Surfers in California often have a variety of wetsuits and surfboards. If a surfer has 3 wetsuits and 6 surfboards, how many different combinations of a wetsuit and a surfboard could the surfer have?
A. 6
B. 9
C. 18
D. 36
Answer:

Question 12.
Writing to Explain
How does a tree diagram make it easier to tell which outcome occurs most often?
Answer:

Question 13.
Lara’s ice skating lesson started at 11:15 A.M. and ended at 12:50 P.M. How long did the lesson last?
Answer:

Question 14.
Think About the Process
Jennifer’s paycheck was $314.79. She used $205.75 of that money to pay bills. Then she spent $58 on groceries. Which expression shows how to find how much money Jennifer has left?
A. $314.79 + $205.75 – $58
B. $314.79 – $205.75 – $58
C. $314.79 – $205.75 + $58
D. $314.79 + $205.75 + $58
Answer:

Question 15.
How many different outfits consisting of one pair of jeans, one T-shirt, and one jacket can you make if you have three pairs of jeans, four T-shirts, and two jackets to choose from?
Answer:

Question 16.
Algebra Find the value of n, if n × 400 = 28,000.
Answer:

Envision Math Grade 5 Answer Key Topic 19.6 Median, Mode, and Range

Envision Math 5th Grade Textbook Answer Key Topic 19.6 Median, Mode, and Range

Median, Mode, and Range

How can data be described by one number?
Answer:
Trey listed, in order, the playing times for the best-selling CD of each music type.
Envision Math Grade 5 Answers Topic 19.6 Median, Mode, and Range 1

Question.
How can he describe the data with one number?
Answer:

Guided Practice

Do you know HOW?
In 1 through 3, identify the median, mode, and range for each set of data.
Question 1.
5, 7, 5, 4, 6, 3, 5
Answer:

Question 2.
21,21,23, 32, 43
Answer:

Question 3.
13, 14, 14, 16, 17, 19
Answer:

Do you UNDERSTAND?
Question 4.
What operation is used to find the range?
Answer:

Question 5.
In the example at the top, how would the median and mode change if the playing time for the Blues CD changed to 61 minutes?
Answer:

Question 6.
What would the range of playing times be if the 72-minute CD was removed from the list?
Answer:

Independent Practice

In 7 through 9, use the table at the right.
Envision Math Grade 5 Answers Topic 19.6 Median, Mode, and Range 2
Question 7.
What are the median, mode, and range for the data?
Answer:

Question 8.
What would happen to the range if the temperature were 82°F on Monday?
Answer:

Question 9.
If the data for Friday were removed from the table, what would the median, mode, and range be?
Answer:

Find the median
List the data from least to greatest.
59, 61, 63, 63, 64, 67, 72
Identify the median, or the middle data value in an odd numbered, ordered set of data.
The median of the number of minutes of playing time is 63.

Find the mode
59, 61, 63, 63, 64, 67, 72
Identify the mode, or the data value that occurs most often in the data set.
The mode of the number of minutes of playing time is 63.

Find the range
59, 61, 63, 63, 64, 67, 72
Identify the range, or the difference between the greatest and least values.
72 – 59 = 13
The range of the number of minutes of playing time is 13.

Question 10.
Ricardo kept a record of the 7 hottest days of the summer. Use the list below to find the median, mode, and range of the temperatures.
98°F 102°F 100°F 99°F
103°F 98°F 101°F
Answer:

Question 11.
Writing to Explain
How can you tell the difference between the net for a triangular prism and the net for a triangular pyramid?
Answer:

Question 12.
Reasoning
For each statistical measure (mean, median, mode, and range) tell whether that number is always, sometimes, or never one of the numbers in the data set.
Answer:

Question 13.
Think About the Process
One side of a rectangular garden is 13 feet and the other side is 3 feet. Which expression shows how to find the perimeter?
A. (2 × 13) + (2 × 3)
B. 13 × 3
C. 2 × 13 × 3
D. 3 + 13
Answer:

For 14 through 17, use the table.
Envision Math Grade 5 Answers Topic 19.6 Median, Mode, and Range 3
Question 14.
What was the median number of visitors to the Statue of Liberty from May through September in 2005?
Answer:

Question 15.
What is the range of the data?
Answer:

Question 16.
How many months had over 500,000 visitors?
Answer:

Question 17.
Writing to Explain
Why do you suppose there had been many fewer visitors in September, than in July or August?
Answer:

Envision Math Grade 5 Answer Key Topic 19.5 Mean

Envision Math 5th Grade Textbook Answer Key Topic 19.5 Mean

Mean

How can data be described by a single number?
How can Carla find the average final score of five bowlers?
Answer:
The mean, or average, is the sum of all the numbers in a set of data divided by the number of numbers in the set.
Envision Math 5th Grade Textbook Answer Key Topic 19.5 Mean 1

Guided Practice

Do you know HOW?
In 1 through 7, find the mean for each set of data.
Question 1.
5, 4, 4, 9, 8
Answer:

Question 2.
19, 55, 34, 16
Answer:

Question 3.
101, 105, 103
Answer:

Question 4.
8, 2, 11,6, 8
Answer:

Question 5.
85, 70, 84, 91,88, 92
Answer:

Question 6.
205, 204, 398, 405, 894, 102
Answer:

Question 7.
28, 32, 36, 40, 42, 57, 58, 59
Answer:

Do you UNDERSTAND?
Question 8.
Another team had 6 bowlers. Would the mean automatically decrease as the number of bowlers increases?
Answer:

Question 9.
In the example above, how could the mean be raised to 90?
Answer:

Question 10.
Writing to Explain Dave said that the mean of 1,2,3,4, and 5 is 8. How do you know this is incorrect without finding the mean?
Answer:

Independent Practice

In 11 through 22, find the mean for each set of data.
Question 11.
2, 5, 4, 5
Answer:

Question 12.
5, 4, 6, 9, 11
Answer:

Question 13.
6, 17, 12, 11,4, 6, 7
Answer:

Question 14.
89, 98, 101
Answer:

Question 15.
17, 30, 45, 46, 27
Answer:

Question 16.
13, 16, 19, 21, 26
Answer:

Question 17.
35, 45, 70
Answer:

Question 18.
40, 41, 54, 55, 66, 79, 43
Answer:

Question 19.
164, 198, 301
Answer:

Question 20.
7.6, 6.2, 6.0, 7.8,
Answer:

Question 21.
11, 8.3, 9.0, 3.7
Answer:

Question 22.
129, 8,002, 1,003, 866
Answer:

Step 1: Add the final scores in the set of data.
Envision Math 5th Grade Textbook Answer Key Topic 19.5 Mean 2
Step 2:
Envision Math 5th Grade Textbook Answer Key Topic 19.5 Mean 3
The average, or mean, score for the 5 bowlers is 86.

Problem Solving

Meredith recorded her score for each game of miniature golf she played. Use her scorecard for 23 through 25.
Envision Math 5th Grade Textbook Answer Key Topic 19.5 Mean 4
Question 23.
What was Meredith’s mean golf score?
Answer:

Question 24.
If Meredith had scored a 50 for the eighth game, how much would her mean score change?
Answer:

Question 25.
In miniature golf, the lower the score is, the better the game. Meredith wants to find the mean golf score of her four best games. What is this mean score?
Answer:

Question 26.
Geometry Which can be modeled by light beaming from a lighthouse?
A. Point
B. Plane
C. Ray
D. Segment
Answer:

Question 27.
Scientists have recorded the lengths of different species of hammerhead sharks. The lengths that have been recorded are 20 ft, 14 ft, 11 ft, and 7 ft. What is the mean length of the hammerhead shark?
A. 12.5 ft
B. 13 ft
C. 17 ft
D. 52 ft
Answer:

Question 28.
Estimation
What is the approximate mean height of the 7 tallest peaks in Texas listed below?
Envision Math 5th Grade Textbook Answer Key Topic 19.5 Mean 5
Answer:

Question 29.
Reasoning
A data set consisting of 3 numbers has a mean of 24. If two of the numbers are 23 and 25, what is the third number?
Answer:

Envision Math Grade 5 Answer Key Topic 19.4 Make a Graph

Envision Math 5th Grade Textbook Answer Key Topic 19.4 Make a Graph

Make a Graph

Data for a company’s sales of mountain bicycles and skateboards are shown in the table. Write two statements that compare the sales of bicycles and skateboards.
Envision Math 5th Grade Textbook Answers Topic 19.4 Make a Graph 1

Question.
Make a line graph for each set of data to help you analyze the data.
Answer:

Guided Practice

Do you know HOW?
Question 1.
In a survey, students were asked to name their favorite pet. Copy the circle below to make a circle graph to show the data.
Envision Math 5th Grade Textbook Answers Topic 19.4 Make a Graph 2
Answer:

Question 2.
Make a bar graph to show the data in Exercise 1.
Answer:

Do you UNDERSTAND?
Question 3.
In the example above, if the trend continues, what can you say about the sales of both bicycles and skateboards in 2008?
Answer:

Question 4.
Write a Problem
Write a real-world problem that can be solved by making a graph.
Answer:

Independent Practice
Question 5.
Mr. Lauer surveyed his students to find out what kind of field trip they preferred. Make a bar graph to show the data. Which field trip is most popular?
Envision Math 5th Grade Textbook Answers Topic 19.4 Make a Graph 3
Answer:

Question 6.
Would a line graph be an appropriate graph in Exercise 5? Why or why not?
Answer:

Plan and Solve
I can make a line graph for bicycle sales
Envision Math 5th Grade Textbook Answers Topic 19.4 Make a Graph 4

Plan and Solve
I can make a line graph for skateboard sales.
Envision Math 5th Grade Textbook Answers Topic 19.4 Make a Graph 5
The sales for bicycles and skateboards have been increasing over the years. The difference between the number of bicycle sales and the number of skateboard sales is becoming smaller.

A survey of 16 people recorded the number of books people read in a month. Joe made a histogram and Jean made a circle graph to show the results.
Envision Math 5th Grade Textbook Answers Topic 19.4 Make a Graph 6

Question 7.
Which graph makes it easy to see that \(\frac{1}{2}\) of the people read 2 or less books in the month? Which graph makes it easy to tell the number of people in each category?
Answer:

Question 8.
Writing to Explain Can you tell from the histogram how many people read 4 books?
Answer:

Question 9.
The data about bicycle sales and skateboard sales at the top of the page could also be shown by a double-bar graph. Part of thengraph is shown at the right. Copy and complete the graph.
Envision Math 5th Grade Textbook Answers Topic 19.4 Make a Graph 7
Answer:

Question 10.
A cafe sells turkey, roast beef, ham, or cheese sandwiches; milk, water, or juice; and yogurt or fruit. How many different meals are possible for a person who wants a sandwich, drink, and dessert?
Answer:

Envision Math Grade 5 Answer Key Topic 19.3 Circle Graphs

Envision Math 5th Grade Textbook Answer Key Topic 19.3 Circle Graphs

Circle Graphs

How can you use fractions and percents to label a circle graph?
Answer:
A circle graph shows how all (100%) of a set of data has been divided into parts. Each part is shown by a wedge (sector) of the circle.

Question.
What fraction and percent represents the part of each circle that is shaded?
Envision Math Grade 5 Answer Key Topic 19.3 Circle Graphs 1

Another Example
How can you make a circle graph to display data?
Answer:
Sixty students were asked to name their favorite sport. How could you use a circle graph to show the results?
Envision Math Grade 5 Answer Key Topic 19.3 Circle Graphs 2

Step 1: Use fractions to find what part of the circle should represent each category. Baseball was chosen by 30 out of 60, and \(\frac{30}{60}\) is 1 or 50%. The wedge for baseball is half the circle.

Football was chosen by 15 out of 60, and \(\frac{15}{60}\) is \(\frac{1}{4}\) or 25%. The wedge for football is \(\frac{1}{4}\) of the circle.
Soccer was chosen by 6 out of 60, and \(\frac{6}{60}\) is \(\frac{1}{10}\) or 10%. The remaining part represents students who chose “other”. It is \(\frac{9}{60}\) or \(\frac{3}{20}\) or 15% of the circle.

Step 2: Draw a circle with sectors for \(\frac{1}{2}\), \(\frac{1}{4}\), and \(\frac{1}{10}\). The remaining sector represents \(\frac{3}{20}\). Label the sectors to show what each part of the circle represents. Often circle graphs are labeled with a percent.

Explain It
Question 1.
If 20 out of 60 students in the survey had chosen baseball, what fraction would represent the part of the circle that should be shaded to show the part of the students who chose baseball? What percent is equivalent to the fraction?
Answer:

Envision Math Grade 5 Answer Key Topic 19.3 Circle Graphs 3
Question 2.
In the circles at the top of the next page, how many of the 12.5% wedges would it take to equal a __ wedge?
Answer:

Question 3.
In the circle at the right, how many wedges should be shaded to show 40%?
Answer:

In the first circle graph, \(\frac{1}{5}\) or 20% is shaded. In the second circle, \(\frac{1}{4}\) or 25% is shaded.
Envision Math Grade 5 Answer Key Topic 19.3 Circle Graphs 4

Some other useful fractions for circle graphs are \(\frac{1}{3}\), \(\frac{1}{6}\), \(\frac{1}{8}\), and \(\frac{1}{10}\).
Envision Math Grade 5 Answer Key Topic 19.3 Circle Graphs 5

Guided Practice

Do you know HOW?
Use the circle below to answer 1 and 2.
Envision Math Grade 5 Answer Key Topic 19.3 Circle Graphs 6
Question 1.
If 4 parts of the circle were shaded, what fraction and percent would be represented?
Answer:

Question 2.
If only 1 part were shaded, what fraction and percent would be represented?
Answer:

Do you UNDERSTAND?
Question 3.
In a survey, 20 people out of 80 chose apple. If you made a circle graph, which sector shown in the example above would represent apple?
Answer:

Question 4.
Use the data below. Copy and label the graph. Label each sector with the correct color.
Envision Math Grade 5 Answer Key Topic 19.3 Circle Graphs 7
Answer:

Independent Practice
A restaurant offers four main course choices on their dinner menu. One evening the following choices were chosen by 20 customers: chicken, 10; beef, 5; turkey, 3; ham 2.
Envision Math Grade 5 Answer Key Topic 19.3 Circle Graphs 8

Question 5.
Copy and complete the table at the right.
Answer:

Question 6.
Copy the circle graph at the right and label each sector with the correct main course.
Answer:

Problem Solving

In two different surveys, students were asked to name their favorite type of movie. The results are shown in the table at the right.
Envision Math Grade 5 Answer Key Topic 19.3 Circle Graphs 9
Question 7.
In which survey did \(\frac{1}{5}\) of the students pick comedy?
Answer:

Question 8.
In which survey did 50% of the students choose animated movies?
Answer:

Question 9.
Copy each circle graph and label it with the type of movie and the percent. You can remove the dashed lines in your final graph.
Answer:

Question 10.
Number Sense
A circle graph is divided into three sections. One section equals 50%. The other two sections are equal in size. What percent of the circle does each of the other two sections represent?
Answer:

Question 11.
A triangle has a height of 16 mm and a base of 6.4 mm. What is the area of the triangle?
A. 22.4 mm2
B. 44.8 mm2
C. 51.2 mm2
D. 102.4 mm2
Answer:

Question 12.
Think About the Process
Sonya spent $ 18 for a book and $22 for a DVD. She paid $2.40 in tax and received $7.60 in change. Which expression shows how to find the amount of money Sonya gave the clerk?
A. 18 + 22 + 2.40
B. 18 + 22 – 7.60
C. 18 + 22 + 2.40 – 7.60
D. 18 + 22 + 2.40 + 7.60
Answer:

Question 13.
Renee mixed \(\frac{3}{4}\) cup of lime juice, \(\frac{7}{8}\) cup of water, and \(\frac{1}{2}\) cup of ice to make a limeade. Which is a reasonable total for the amount she mixed?
A. Less than 1 cup
B. Between 1\(\frac{1}{2}\) cups and 2\(\frac{1}{2}\) cups
C. More than 2\(\frac{1}{2}\) cups
D. Less than 2 cups
Answer:

Question 14.
A survey asked 200 people to name their favorite type of fruit. The results were as follows: apple, 100; banana, 50; orange, 25; other, 25. Which graph best represents the data?
Envision Math Grade 5 Answer Key Topic 19.3 Circle Graphs 10
Answer:

Mixed Problem Solving

Objects on Jupiter weigh about two and a half times as much as on Earth.
Envision Math Grade 5 Answer Key Topic 19.3 Circle Graphs 11

Question 1.
Complete the table below and then graph the values on the coordinate grid.
Envision Math Grade 5 Answer Key Topic 19.3 Circle Graphs 12
Answer:

Question 2.
If a dog weighs 75 pounds on Earth, about how much would it weigh on Jupiter?
Answer:

Question 3.
If Tyler weighs 120 pounds on Jupiter, about how much would he weigh on Earth?
Answer:

Question 4.
Complete this table using the graph that shows the Big Dipper.
Envision Math Grade 5 Answer Key Topic 19.3 Circle Graphs 13
Answer:

Question 5.
If you were to move this drawing of the Big Dipper 3 units to the right on this grid, what would be the ordered pair for point D?
Answer:

Question 6.
Strategy Focus
Examine the ordered pairs for Points Cand E. How do you know that a vertical line can connect those two points? Explain how you decided.
Answer: